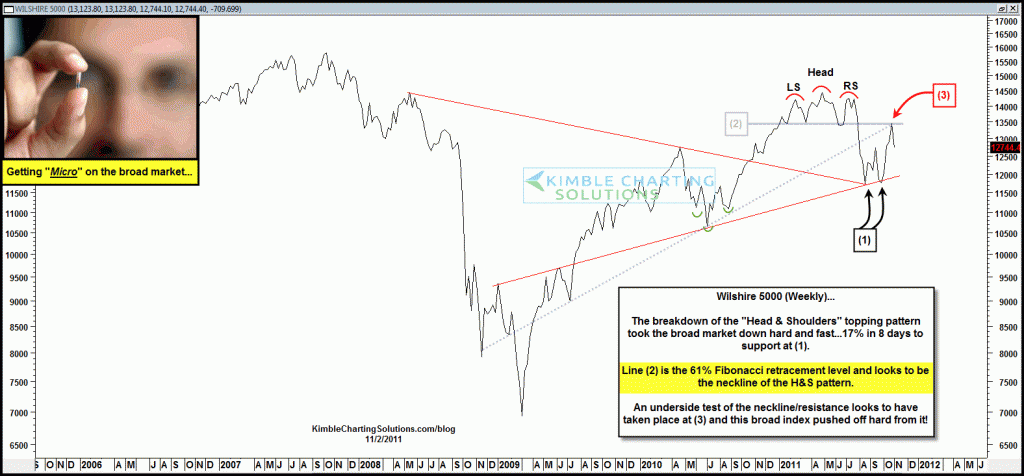
The Wilshire 5000 looked to have created a very bearish right shoulder at the end of July. (see post here) What followed? A 17% decline in 8 days! Then what? The Wilshire 5000 looked to have found support after this large decline and was due a bounce (see post here)
Last week (10/27) I shared that the big test would be the “Underside of the Neckline” of the “Head & Shoulders” topping pattern (see post here) Below is an update to the H&S pattern in the Wilshire 5000 index…
CLICK ON CHART TO ENLARGE
At (1) in the chart above, “cash became the crowded trade” per the Rydex ratio (see lower chart in this post). The rush into cash about the time support was hit most likely contributed to the article below from CNBC’s website on 10/27.
Hmmm….best month in 37 years and the Wilshire 5000 hits the underside of the neckline of the “Head & Shoulders” pattern….wonder what will happen next? Should the action of the past two days come as a total surprise?
Broad market support and extreme fear contributed/had a large influence on a rather good performance for the month of October. Using the broad market/Wilshire 5000 as a guide, the “neckline” remains stiff resistance and until the neckline is taken out to the upside, rallies should be viewed as counter trend.


