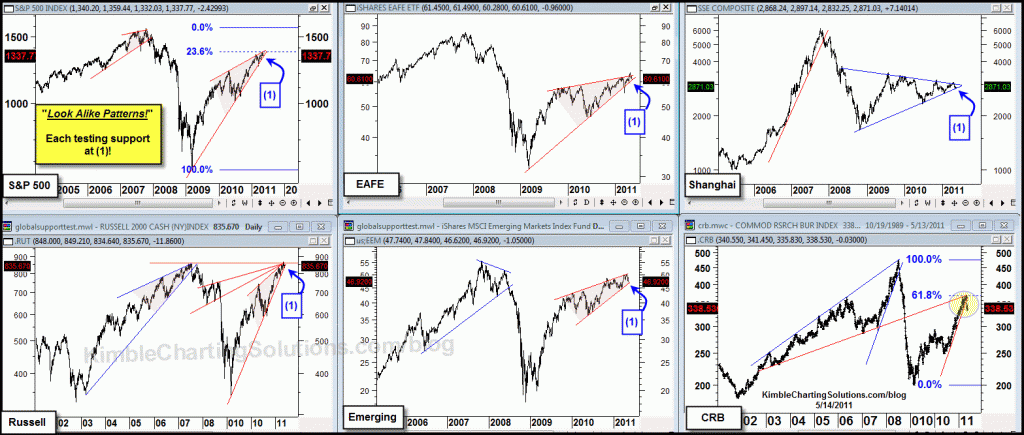
Last May the “Power of the Pattern” was reflecting the following situation in the 6-pack below….Global markets were all looking alike, creating bearish rising wedges and that if one support line was to break, they all should, due the the high degree of correlations. (see post here)
The post shared that their was a good chance that all of these markets would fall in price.
CLICK ON CHART TO ENLARGE
These bearish rising wedges reflected a two-thirds chance they would all fall in price and THEY DID!!! Once these key global markets broke support, all of them moved lower.
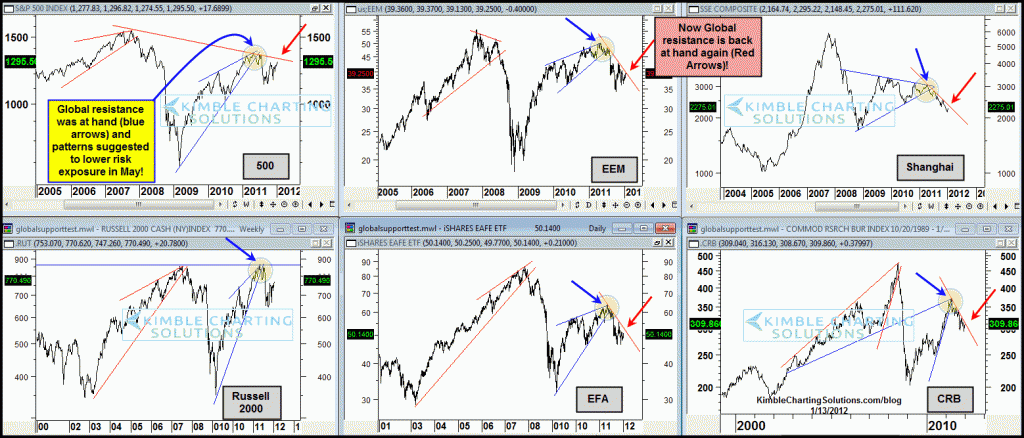
Below is an update to the above 6-pack, reflecting the breakdown and that the majority of they key markets continue to form similar patterns and are facing falling resistance.
CLICK ON CHART TO ENLARGE
These repeating patterns reflect that risk is high on two fronts….until proven differently, global resistance is at hand and it is very hard to use diversification as a risk reduction tool!


Aaron…
To know if the 500 index would reach 900 by year end, is way above my pay grade. At this time a few positive snow flakes are falling… Bank breakouts/relative strength has taken place of late, same with IYR/XHB too.
Speaking of breakouts, the very hard hit EEM/EWZ ETF’s are attempting to break resistance ( I like these breaks!) . My “shoe Box” indicator isn’t reflecting a great deal of “risk concern” at this time either.
One of my favorite markets to watch is the Wilshire 5000, which remains inside of a solid/boring flag pennant pattern, which could last for months to come!
Chris
Hi Chris,
I have learned one important rule when it comes to investing and that is that true market moves are processes and not events.
Looking at the broader picture, a couple of things stand out:
1. Main primary trendline coming off the Mar 2009 lows was crossed this past summer.
2. The new trendline is down and until the price clears this resistance trendline will lead the market lower. The level appears to be ~1315. A close and subsequent hold at this level would mean that the markets move would now be up. The key resistance level from the trendline from 2007 to 2011 highs would be ~1320-1330 in next 4-6 weeks. Inability of market to breach this resistance line would mean that downward move will continue.
3.Backtesting all trends to the 1920s concluded that every time the primary trendline is eclipsed/broken a bear market lasting at least 1.5 years has occurred. No exceptions.
4. If downtrend is in place then S&P would be near 900 at the end of this year.
5. I know this is only history talking, buy has my attention.
Chris at what point do you feel like a new trend line has begun?
Aaron
Stock markets and US dollar at resistance. Which way are you leaning? One must be wrong ….No!