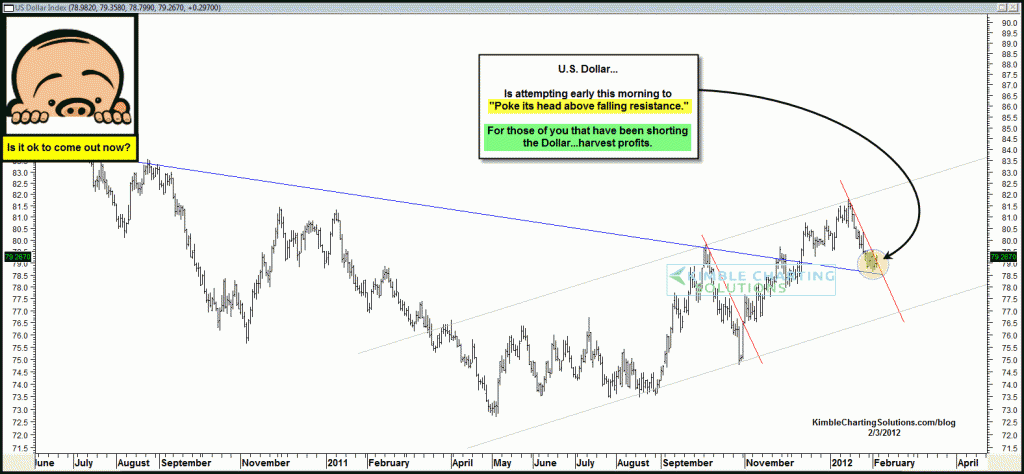
On 1/12 the “Power of the Pattern” reflected a bearish wedge was in place in the U.S. $, which reflected a two-thirds chance the dollar would move lower in price. (see post here) For those that took this pattern as an opportunity to short the Dollar, its been a good ride. See below for action to be taken…
CLICK ON CHART TO ENLARGE
For those of you that have be short/scoring on defense in the Dollar, harvest the gains. The day is long from over for sure and the Dollar could turn tail and keep moving south. Due to support being at hand, add some pocket change by taking profits.


Nice Neckline retest
2 possible Bull Flags
The Hilbert Sine Wave has a Cycle High on the Euro,
The most robust 56&65 day Hurst Cycles, are at a Cycle High on the Euro
Will a rising Dollar puts pressure on Equities & lift US Bonds or visa versa
Intermarket Analyzes Question is Correlation:
Is the last move up in Equities to be a Bull Trap with the Dollar the clue, or will the Dollar and Equities move up together, with US Bonds moving as a safety valve according to the crisis of the week
Dan…I appreciate your viewership and the thousands of others around the world.
Chris
Thanks as always for the analysis. I’m learning a lot from your site!
Dan…Not seeing the wick so far.
The leaders of the past 60 days, XLF/XHB/IYR are all breaking above their resistance lines. Ole Mo is in charge at this time and few negative snow flakes are falling.
High yields breaking above neckline and creating their own “golden cross” a decent sign? (see High yield Golden cross here)
So Chris, would you consider today’s move in the 500 to be a big fat bearish wick rather than an upside breakout?