CLICK ON THIS CHART TO ENLARGE
Ever want to cover your ears due to excess noise and info overload?
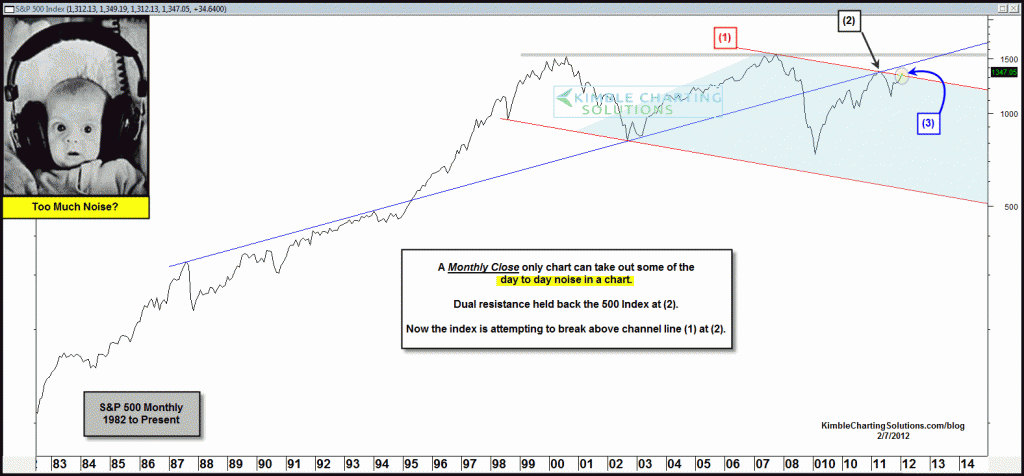
Every once in a while I like to take a 30,000 foot view of the markets in a quiet way, by looking at a long-term Monthly closing chart. This Monthly chart reflects the 500 index has formed a falling channel, with line (1) being the top of this channel.
Last year dual long-term resistance stopped a rally at (2). The 500 index is now making an attempt to break from this channel at (3).


