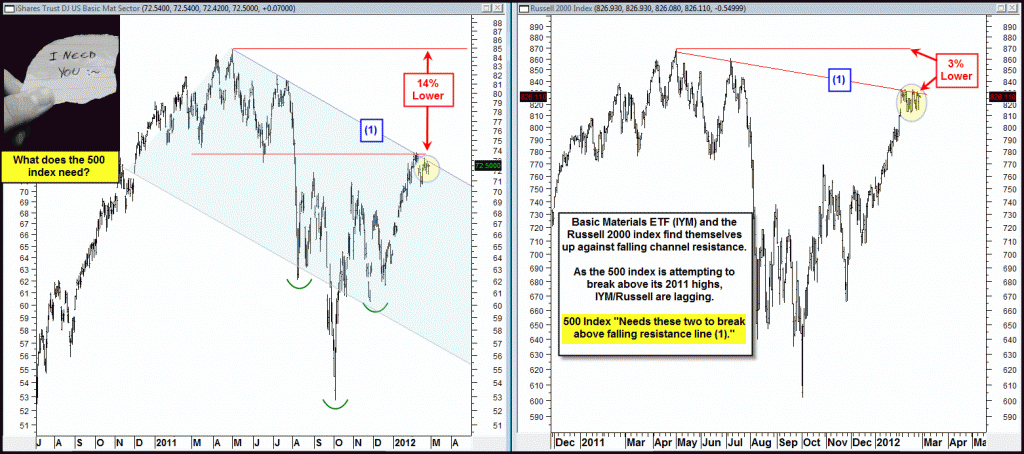
Last week the Power of the Pattern reflected thatBasic Materials were lagging the broad market by a 14% , (since last April highs) and that for the broad market to move higher, the 500 index needed Basic Materials and the Russell 2000 to break resistance in the chart below (see 2/28 post)
CLICK ON CHART TO ENLARGE
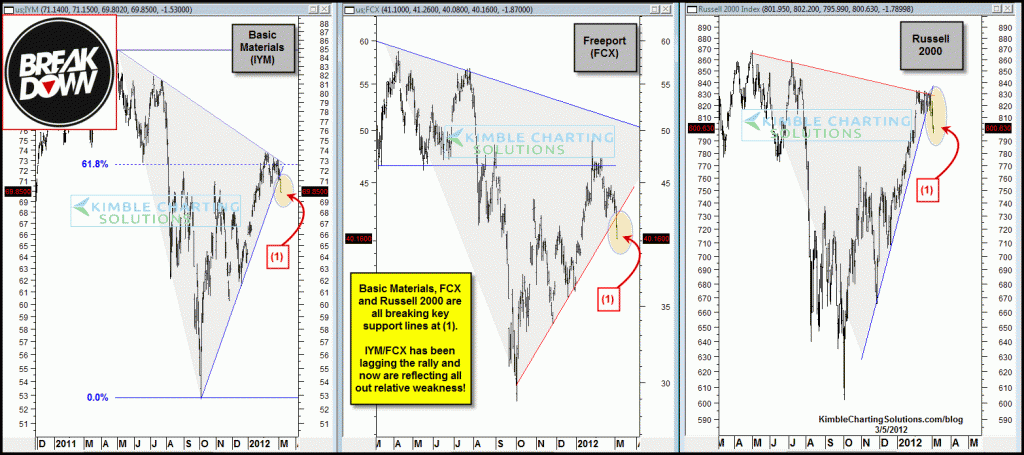
The chart below reflects that one week later, breakdowns in key sectors are taking place…
CLICK ON CHART TO ENLARGE
Joe Friday shared this past Friday that the Russell 2000, NYSE Composite and the Wilshire 5000 were all up against key over head resistance lines (see post here) . Breakdowns in IYM, FCX and the Russell 2000 are not what long investors want to see when key Resistance is at hand!
The breakdowns suggest capital protection/harvesting should be considered at this time. If you are interesting in scoring on defense, these breakdowns do suggest an opportunity is at hand with overhead stops.


Aaron…
Insiteful as usual and always appreciate your kind words. Glad that the “Power of the Pattern” has been of benefit to you.
Keep up the great work and congrats.
Also Thanks for your continued and consistent viewership,
Chris
DG…
Thanks for the kind words and sharing your creativeness! Love it.
Appreciate your viewership and that you get the P.O.P.!!!
Chris
Josh,
Russell hit a lower support line today. A break of that and RWM would do very well!
Chris
Hi Chris,
Thanks for the candid post above.
Investing/Trading is a daunting task. Last Summer I decided to split my money into 10 strategies and one of them was following your blog.
I won’t go into detail here. I have an entire walk in closet full of books covering stocks and the like since the 50s. I actually have numerous books from each era.
I do not know where the market will be in 1yr, 5 yrs, or 10 yrs, but here are the facts:
1983 to 2000 was a huge bull market. The last Secular Bear market was from 1966 to 1982 and there was sideways movement through the entire period (1966: S&P = 92, 1982: 109). There were 3 higher highs and 3 lower lows from 1966 to 1975. I wonder if history will repeat itself? If so, then we might see all time high before dropping off of a cliff sometime before 2020.
Needless to say, your blog has helped me steer clear of danger. when you say “Protect Assets”. You said to do such a thing in July which saved me a bundle. I immediately go to cash and some bonds. I am usually not quick enough to short.
I still have to give you props for a chart you posted (last August I believe)on the SPX that showed strong support in the 1050 to 1090 area. I went with it and moved to 80% invested.
I also took your suggestion and overweighted XLF and IYM then I sold them at the beginning of Feb.
Can’t thank you enough.
Aaron
Power of the Pattern continues to work for Kimble et al!
It’s clear, that YOU ARE THE PAT-TURN KING! 🙂
Your uncanny ability to identify all major turns – great talent. THANKS for sharing, as always.
dg
Statistically speaking, would this be a reasonable time to use the RWM ETF, or something similar?
Belsha….
One of my main concerns in the Basic Materials sector is the relative weakness, prior to the break of support. In the past, during quality bull markets, IYM either kept up with or outpaced the broad market. The S&P 500 is back at last years highs, yet IYM was 14% below those same levels last week.
If history is a guide, this is not the price action you want to see for higher broad market prices. Along those same lines, even though high yields bond price action has been ok, they are well below last Aprils highs as well. In the past, this isn’t quality price action either.
Chris
Would you see a pullback towards resistance/former support in those indexes (especially the Russell) before further declines, thus providing a better short entry point (and possible new highs on the other indexes)?