On 5/14/2011 the 6-pack below was posted, as the “Power of the Pattern” was reflecting - multi-year bearish rising wedges were taking place around the world and rising wedges two-thirds of the time results in lower prices (see 5/14 post here) .
The pattern concerns 11 months ago were….Rising wedges were taking place around the world and if one support line broke, they should all fall like dominoes, since correlation was so high.
CLICK ON CHART TO ENLARGE
Below is an update to the above 6-pack, reflecting investment results and current pattern updates.
CLICK ON CHART TO ENLARGE
Since the collection of rising wedges took place, the S&P 500 is up 6%, the Russell is up .5% and the remaining four are all 7% or more below the tops of their wedges, creating a series of lower highs at falling resistance lines.
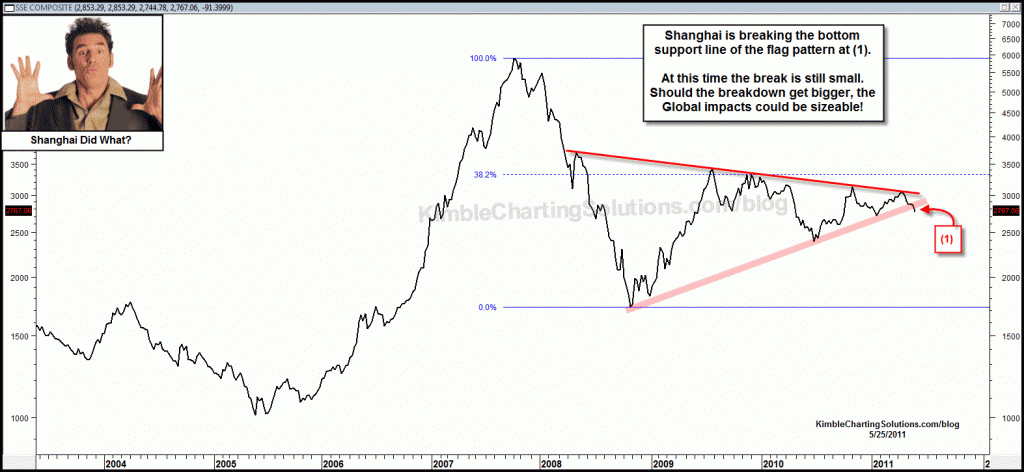
11 days after the first 6 pack was shared, the Shanghai Index (the sole chart creating a flag/pennant pattern) was breaking below its flag pattern in the chart below posted on 5/25/11 (see post here)
CLICK ON CHART TO ENLARGE
The Shanghai index is the weakest of the lot, currently 22% lower than the day it broke supporr in the flag pattner on 5/14/2011. No doubt global markets have been weaker than the major markets in the States.
The up-to-date 6-pack reflects the following…. The world does not look exactly the same as it did on the 5/14/2011 post, due to the global markets are lower than their wedge peaks of last year. The S&P 500 and the Russell are up against resistance lines that should be respected as the global markets continue to create a series of lower highs.


Hi Chris,
Looks like IWM on the daily chart formed a “kiss of death” today. The trend line thru October/November/March lows was broke yesterday and today tested the bottom of the trend line.
My RWM play is looking better and better. It is just under 50 DMA. It goes without saying that the channel line breakout that occurred yesterday does not bode well for small caps.
Aaron
Chris,
I continue to appreciate your pointing out these types of patterns. Although we know nothing is a sure thing as far as future direction is concerned, we can still look at things like this and be much better prepared according to the probabilities. The power of the pattern as you say.
Thanks Much…
Chris,
Thank you for your awesome sight. I have been a long time viewer of your work, since finding you on dshort.com.
I love these multi-chart macro snapshots. Your “look alike” post of last May helped me pull risk assets off the table, which saved me money and avoided a rough summer.
I appreciate your “look alike” update. Your timing might have been as great this year as it was last year.
How do I get Premium info and have you ever considered a slow trading macro service to help people with 401k’s plans?
Keep up the great work and Thanks again!
PJK
Aren’t we seeing pretty huge head and shoulders patterns on the EEM, the EAFE, and even a very tilted version on the RUT?
I’m heavily short now, on french (doing great) and german (just getting even, picked it too early) indexes right now. How far could this go for you? I personnaly believe in a 10% correction going from here, that is 1280 or so on the SP500, but possibly this could go mich farther. Your idea?