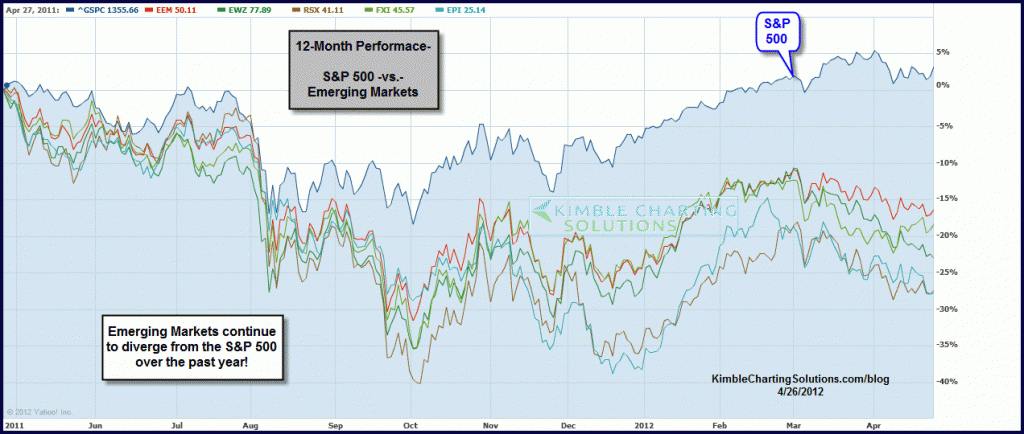
Its very easy to read research papers from Wall Street firms or hear money managers on CNBC tout that the real growth story continues to lie in the “Emerging Markets” arena. They may be correct in the longer-term, yet the Power of the Pattern reflected that bearish rising wedges were taking place all around the world a year ago (see Look alike patterns here) and that the Shanghai flag breakdown should hurt the Emerging markets arena (see Shanghai post here)
What has ownership of the Emerging markets countries done for a portfolio over the last year? Lowered returns!
CLICK ON CHART TO ENLARGE
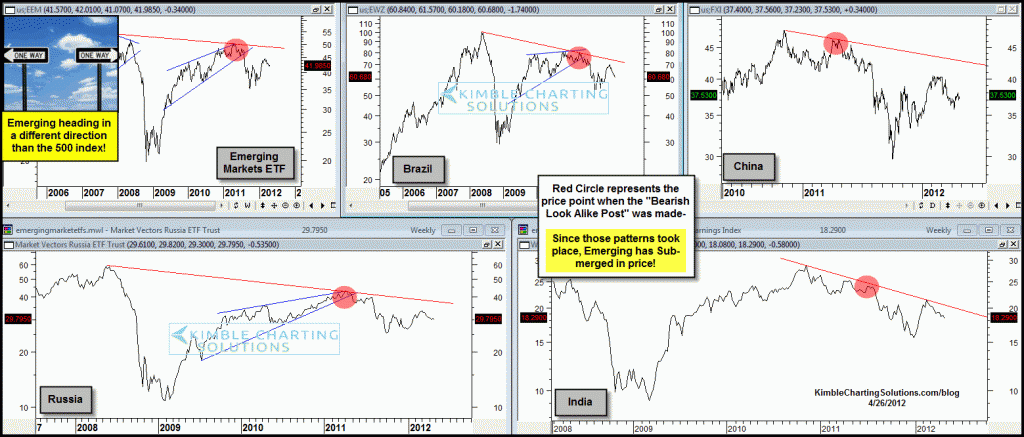
The 6-pack below represents Emerging/BRIC ETF’s and their price struggles since large bearish rising wedges took place a year ago.
CLICK ON CHART TO ENLARGE
Two-thirds of the time multi-year rising wedges take place, prices move lower into the future. Emerging markets continue to struggle in price after breaking below rising wedge support, as they create a series of lower highs. The BRIC countries might be the growth engines of the future, yet over the past year, they’ve be a real drag on portfolio performance.
The key for this arena going forward….watch for bullish falling wedges to form.


Chris – I love technical analysis but I believe the FED is continually managing the stock market. It has become it’s only tool with inflation running at two percent. All you have to do is look at the recent data on the clevland Fed’s website entitled Credit easing tools – http://www.clevelandfed.org/research/Data/Credit_Easing/index.cfm.
At the recent turning points of the market the Fed announced (or did not in the case of MBS) the forthcoming increase in its balance sheet and the monetary base through it’s mechanisms.
In november 2011 they announced the currency swaps (turning point in stock market) and then the swaps blasted off (going from 1 to 110 billion in a heartbeat) while simultaneously juicing MBS holdings 20 billion in one week in early January – they both juiced the market near lows.
Most recently the Fed injected a quick 24 billion of MBS expansion again last week at the turning point of the recent decline.
The huge MBS expansion on cleverly chosen weeks is especially disturbing since I can find absolutely no correlation in the schedule of upcoming purchases – http://www.newyorkfed.org/markets/ambs/ to when the balance sheet increases or decreases each week. The FED is using this tool to inject high powered money into the system when the market suffers a downdraft. The data indicates the FED draws down the MBS balance sheet when the market is doing fine on its own so that it has a cushion to inject 20-30 billion on weekly basis when it is needed.
Additionally the fed’s “other assets” (whatever that is) balance sheet is almost a mirror image of the stock market rise from 2009 – http://www.clevelandfed.org/research/Data/Credit_Easing/index.cfm
When the FED is increasing the balance sheet through mbs,swap and other assets and thus the monetary base they are directly trying to manage the stock market in my opinion. The correlation to market lows is too high for it not to be the case.