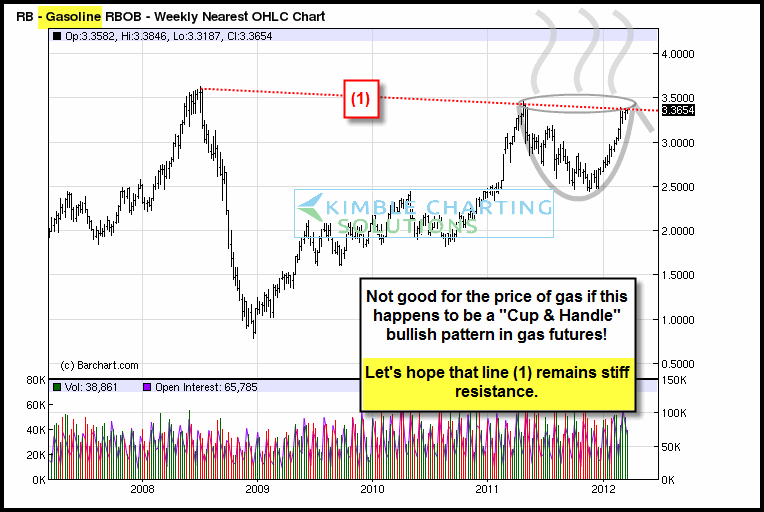
The Power of the Pattern reflected that most wouldn’t want this “Cup & Handle” pattern to come true, because if it did, gas prices could push towards $5 a gallon (See post here)
CLICK ON CHART TO ENLARGE
The chart below reflects that the falling resistance line (1) looks to have held Gas futures from heading higher.
CLICK ON CHART TO ENLARGE
Declining gas prices are nice at the pump, yet sometimes correlate with lower stock prices too…stay in touch with where Gasoline goes from here!


