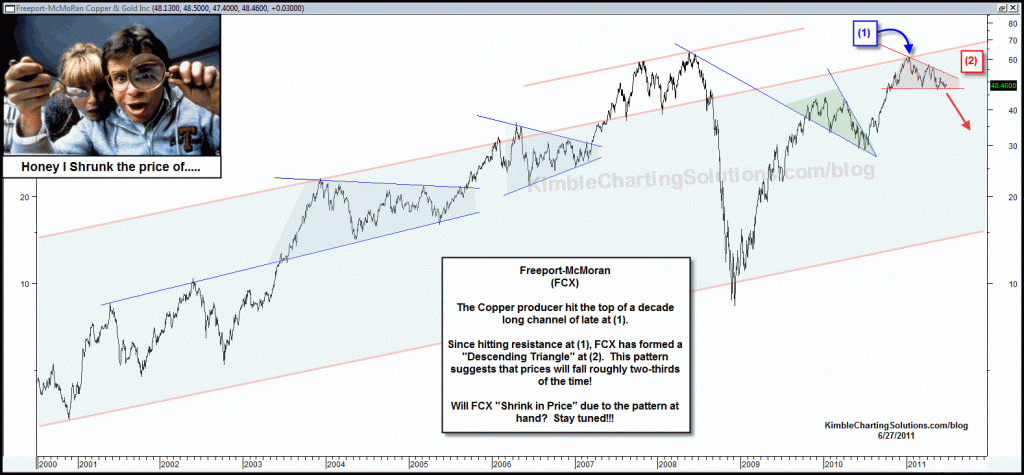
One year ago the Power of the Pattern was reflecting in the chart below, that a bearish descending triangle was taking shape in the worlds largest Copper producer, FCX. (see post here)
What soon followed? FCX lost 37% of its value in 90 days!
CLICK ON CHART TO ENLARGE
Is one company that important or the driving force of the world? NO! FCX can be a decent indicator for the global economy and where the broad markets headed though! After the breakdown of the descending triangle, FCX lost 37% of its value in 90 days and the S&P 500 declined just under 10%….global markets were soft as well.
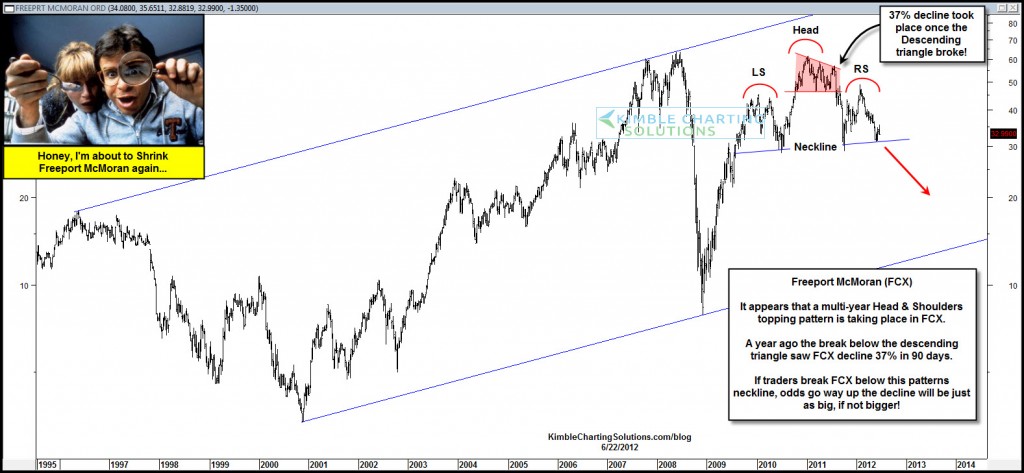
Now turn the page forward a year and what does the pattern in FCX look like?
CLICK ON CHART TO ENLARGE
A year ago it paid to structure a portolio, become protective/reduce risk exposure, due to the pattern in FCX….time will tell if this pattern is correct in suggesting to do the same again!


Thanks for the chart. The neck line is around $29, so there is still some wiggle room left. The left side had multiple shoulders so it is possible for a second right shoulder to develop over the next month. In addition, a Demark Weekly Combo Buy signal was issued a few weeks ago in FCX.