CLICK ON CHART TO ENLARGE
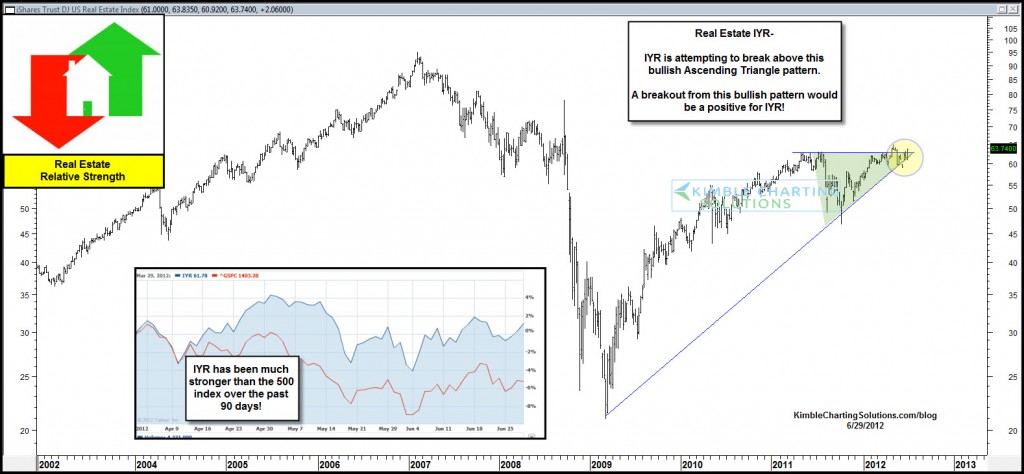
Real Estate ETF (IYR) looks to be forming a bullish ascending triangle over the past few months and has performed much better than the 500 index over the past 90 days.
Odds favor an upside breakout from this pattern and IYR should continue to reflect relative strength over the 500 index!


Mark and Dan… Another reliable pattern is a pennant. If a bullish trend immediately preceded it, it will break upward two-thirds of the time. Likewise, if a bearish trend immediately preceded it, it will break downward two-thirds of the time. Volume tends to diminish as the pennant/flag gets closer to completion.
The only thing about this pattern is if you are using CK’s TBM strategy, you might not be looking for this pattern since it is only found during the Middle of the run. (TBM=Tops, Bottoms, No Middles) When CK marries trend line support with sentiment indicators (that identify crowded or uncrowded trades), you have a perfect low risk high reward signal.
Mark…Rising wedges break down two-thirds of the time and ascending triangles break upwards close to the majority of the time.
I did highlight ascending triangles in the workshop, in Silver, 100% rallies soon followed.
Chris
I think Dan’s question was about the difference between a triangle and a wedge. I’ve wondered the same thing. I think Dan has it right: an ascending triangle as a horizontal resistance line on top; a rising wedge is bound by two rising lines that are converging. Here are references:
Triangle:
http://stockcharts.com/school/doku.php?id=chart_school:chart_analysis:chart_patterns:ascending_triangle_c
Rising wedge:
http://stockcharts.com/school/doku.php?id=chart_school:chart_analysis:chart_patterns:rising_wedge_reversa
Others:
http://stockcharts.com/school/doku.php?id=chart_school:chart_analysis:chart_patterns
As for why these are different – I have no idea. My guess is that a wedge represents the exhaustion of a rally with a series of higher highs that are getting weaker and weaker. (Chris’ webinar showed some of this, I think.) Whereas I picture an ascending triangle as: rising trend runs into resistance and blasts through it.
Does any of this make sense? Of course, the main thing is to recognize the patterns when they happen!
Dan…Great question…
Ascending triangle….(see here)
Descending triangle See here
See the above links for the patterns you ask about.
Let me know if this was what you were looking for.
Thanks for your viewership Dan,
Chris
Chris,
How do you distinguish between a bullish ascending triangle pattern and a bearish ascending wedge? Does the mere creation of a flat upper trendline make the ascending wedge necessarily bullish?