CLICK ON CHART TO ENLARGE
I shared a chart on the blog yesterday, that I had shared with Premium members 11 days ago, reflecting that bullish sentiment was rather low as the broad markets were on support. This combo was suggesting it was a bright idea to go long the markets (see low bullish sentiment here)
A long time viewer of the blog (see John Butcofski stock Twits here) sent me the above chart, reflecting that at the same time support was in place (in the NYSE) and bullish sentiment was very low, the advance decline line (top half of the above chart) was actually moving higher….reflecting underlying relative strength!
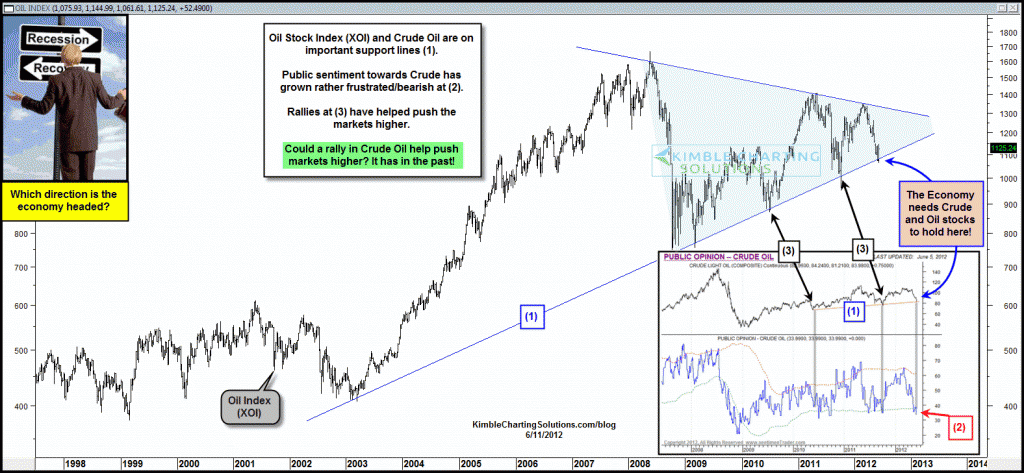
Is a rally in Crude oil good news for the stock market?
CLICK ON CHART TO ENLARGE
The above chart was first posted 8 days ago on dshorts advisor perspectives, reflecting very few investors were bullish crude oil and Crude happened to be on support (see Crude oil post here)
The markets are reflecting some relative strength, via the advance decline line is improving along with the NYSE, Wilshire, Crude oil are also bouncing off of key support!


Great charts. I like the top one. So many bears in the boat right now, I feel like we could be ripe for a move up.
USO def looks like it could make a jump up at its sitting at key support.
Price is King when it takes out the Head & Shoulder Neckline decisively, that is being retested in a counter trend rally, that kicked off this last correction, will there be a new direction up
Longer term the NYSE looks to be in a 2.5 year old Rectangle and/or building a Head & Shoulders, the bottom of the Rectangle being the Neckline, this being said as to Price is playing in the treacherous part of the playground