CLICK ON CHART TO ENLARGE
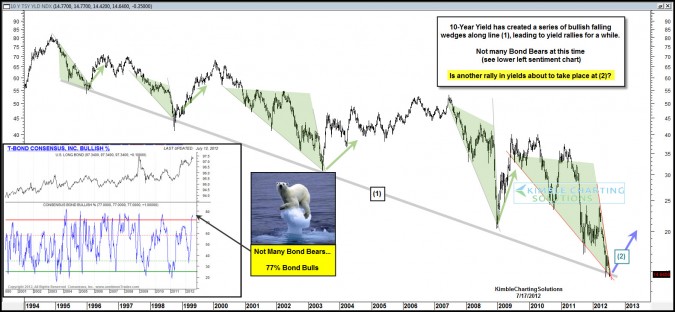
10 days ago the above chart reflected a bullish falling wedge was taking place in the 10-year yield and bond bulls were everywhere. (see post)
CLICK ON CHART TO ENLARGE
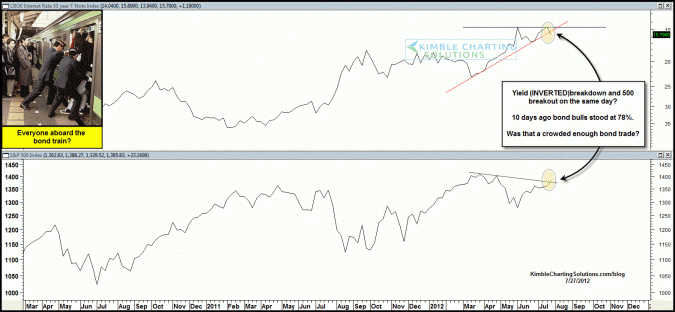
This post reflected that Wall Street Strategist LOVED BONDS and HATED STOCKS…reflecting the biggest spread in 15-years! (see post here)
Are too many people on one side of trade right now?


Mark S – that’s my opinion too, but I believe it will be on poor breadth with SP500 and Commodities getting the lions share of the break upward. If we are entering a major top in the market, large caps (SP500) will do the best. That is exactly what I am seeing — notice the recent under-performance of the Russell and MidCaps.
Hi, Chris:
Stocks and bonds continue to mirror-image each other! Today the S&P gains 2% and TLT loses 2% – still the same. Maybe it will change – but I don’t see any break in the pattern yet. Every big bond drop in the last 3 years has coincided with a stock rise.
So if the bond pattern suggests a big break – is that a hint that the S&P and other indices may be poised to break up??
Wait until Bernanke actually caps interest rates across the whole curve.
Anyone short bonds will get carried out.
You really think they’ve done QE1, QE2, and next week’s QE3 just to have it all come apart?
It is never going to unravel. He will buy every bond in creation for the Fed balance sheet if he has to.
Who is going stop him? He has gone rogue, and has no check or balance against him.