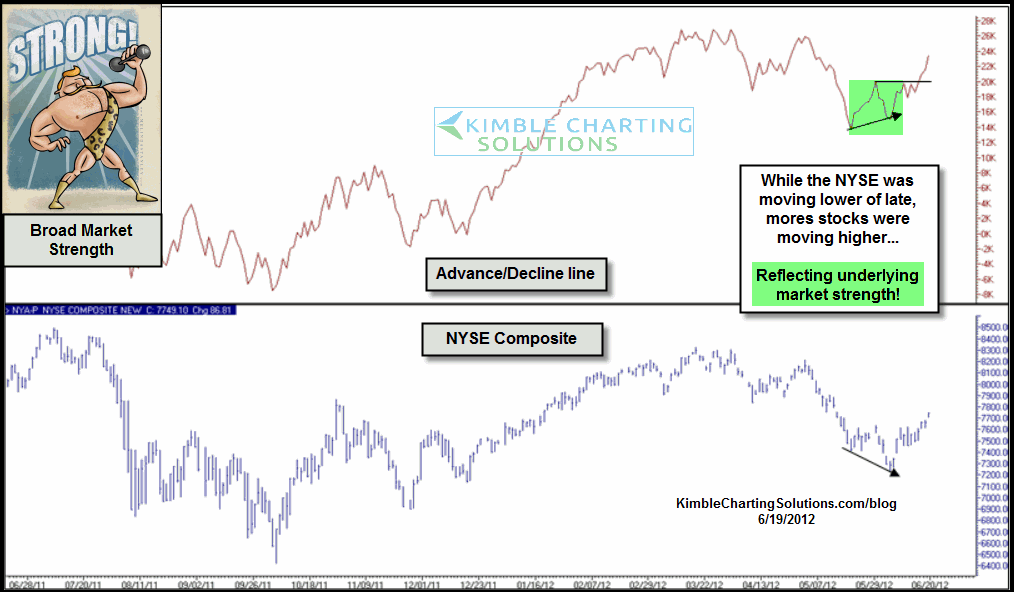
Shared this chart with Premium Members a few days ago, reflecting that the NYSE A/D line was hitting all-time highs.
CLICK ON CHART TO ENLARGE
On 6/19 the Power of the Pattern was reflecting a good sign in the broad market (suggesting higher stock prices), when the A/D line was moving higher, even though the NYSE was was not, in the chart below. (see original A/D line post here)
CLICK ON CHART TO ENLARGE
The first chart reflects that the NYSE A/D line is hitting new all-time highs and the Kimble Charting Solutions “Shoe Box” indicator is reflecting similar strength at the same time.
If history is a guide, the A/D line and Shoe Box tools need to head south, before the broad market is in trouble!


