CLICK ON CHART TO ENLARGE
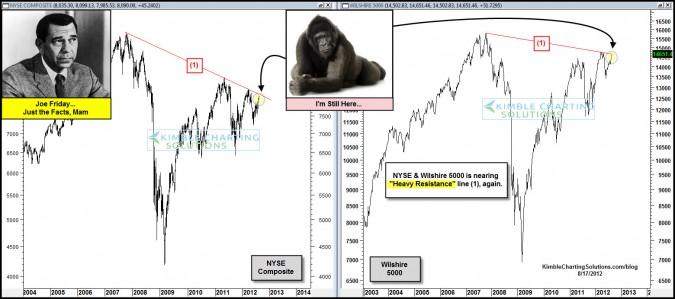
Two of the broadest market index’s in the United States are back at resistance that has stopped their rallies over the past few years. Can these key markets push aside the 800 pound gorilla?
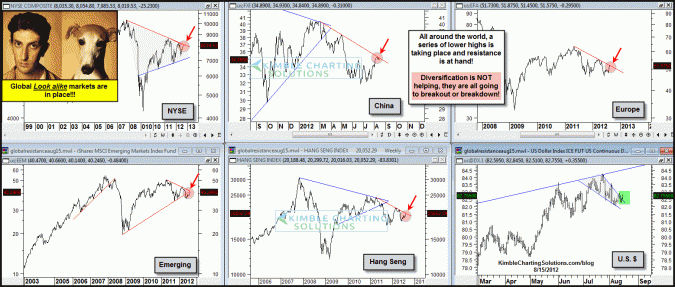
Is the U.S. broad markets the only one’s facing key falling resistance lines? The 6-pack below was sent to Premium Members a few days ago.
CLICK ON CHART TO ENLARGE
This 6-pack reflects that world markets are also facing their own 800 pound falling resistance lines.
With world wide market correlation extremely high, what the markets do at these resistance lines is one of the most important technical situations in years!!!
Another “Look Alike, Dominoes and Slippery Slides” set up at hand? (see post here)


