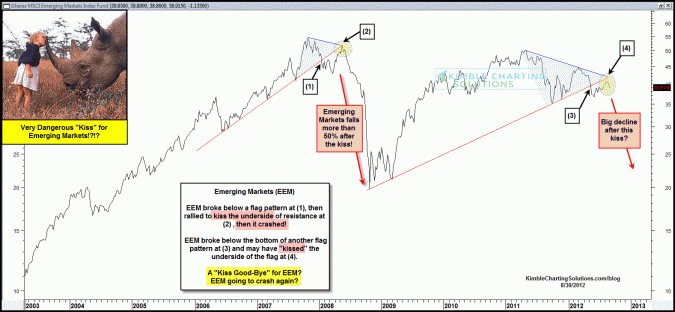
EEM broke below a flag pattern, tried to rally and failed as it “Kissed” the underside of resistance at (2) in the above chart and proceeded to decline 50% in a matter of months!
Currently EEM broke below another flag pattern, then rallied up to the underside of resistance.
Potential “Very Dangerous” kiss of resistance for EEM just take place? For Sure!!!


