CLICK ON CHART TO ENLARGE
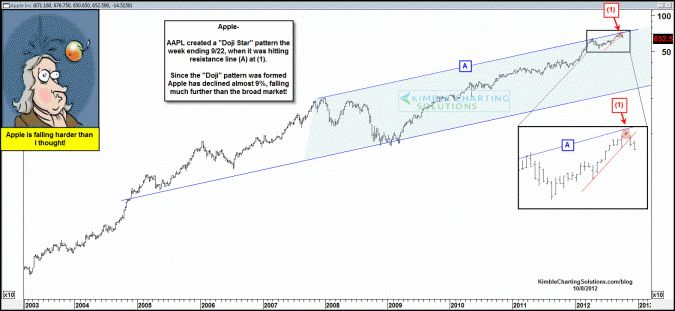
In less than 3 weeks, Apple has declined almost 9% in value, while the S&P 500 is flat.
Did something take place to suggest this would happen? It might have!!!
The chart below reflects that Apple might have created a “Doji Star Reversal” pattern on the week ending 9/22 at (1) in the chart below. Since that pattern took place, Apple has reflected unusual relative weakness!
CLICK ON CHART TO ENLARGE
Apple falling 9% doesn’t mean the broad market is in trouble! The Doji Star taking place at the top of Apple’s rising channel does reflect that the tech sector could reflect relative weakness for a while though!
If the NYSE A/D line starts to reflect weakness and Apple continues to fall more than the 500 index, one might respect that message!


