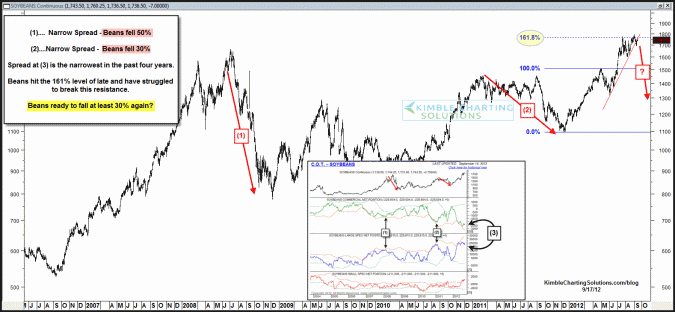
A month ago the chart below was shared with Sector Sentiment Extreme members, reflecting that Soybeans had the potential to fall at least 30% in price. (see post here)
Why at least fall 30% in price? The last two times traders held such extreme long positions in beans, they fell 30% in price last year (2) and 50% in price in 2008 (1), in the chart below.
CLICK ON CHART TO ENLARGE
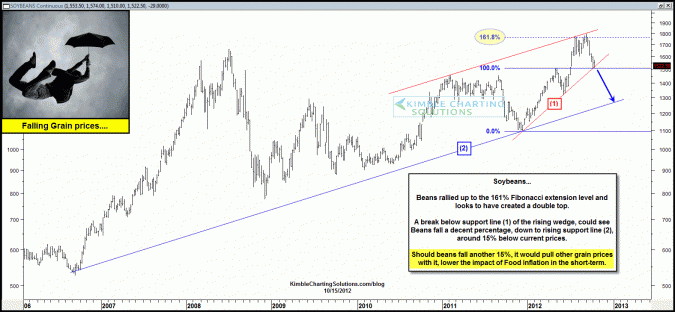
A month ago Soybeans were trading at $17.36, Friday beans close at $15.22, falling 12% in less than a month.
CLICK ON CHART TO ENLARGE
A break below the bearish rising wedge support line (1) could see Beans fall another 15% in a hurry. The top charts inset, reflects that traders had a huge long exposure to beans a month ago, which suggested that if Beans would decline, a ton of traders were going to lose a lot of monies (Soybean Prices Quote). Traders remain having a huge long exposure to beans as of last Friday, despite the 15% decline over the past month.
Long bean traders have lost a good deal of money over the past month! If beans break support, the traders that are on the long side could be forced to sell, pushing beans down all the quicker.
A grain decline could help ease food price inflation concerns!
–


