CLICK ON CHART TO ENLARGE
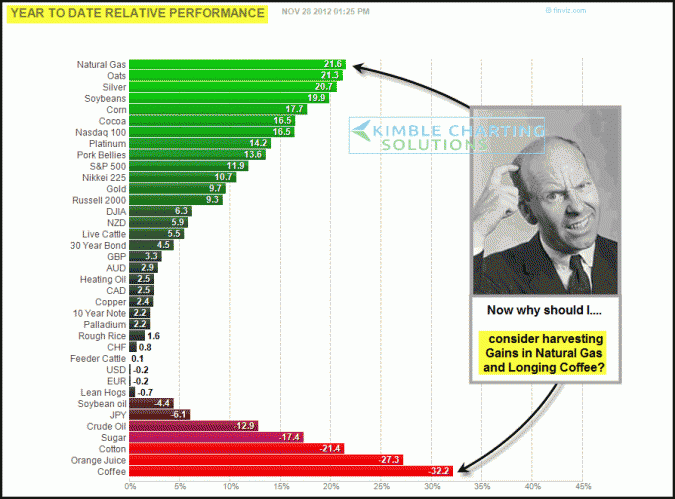
The above chart reflects a wide variety of products performance, year-to-date! Two assets to note are… Natural Gas, up 21% YTD and Coffee down 32% YTD.
Why should investors consider harvesting long positions or shorting Natural Gas? Power of the Pattern suggested to take this action last week in NG. (see harvest NG here)
Why should investors consider going long Coffee with stops just below support? (see why buy coffee on support here)
–
–


I love that people think this is ugly!
Tell when you’ve made good money and it was an easy looking trade in the beginning!?!?
Hello, Chris ! They definetly digested your chart ! (JO) is up in double volume creating qood bull engulfing ! (JVA) and (GMCR) also are up on good volume ! (CBOU) looks like getting back to trade volume !(Sbux) spikes at the edge ! You said COFFE ! The COFFE IT is ! Thanks again for heads up !
Hi guys .. a thought ..If one would llo at last years chart… i bet the greens were the red and the reds are now the green..
Would this not be a great choice…. doing the opposite of what is extreme…. as you cotton and coffee was all time high??
Is this not the tower charting..like apple…weay up and then way down.
Anyways take a look at it as to the charts.. ??see how it looks ….thats a WHAT WOULD DO..question of the week..
fr:
Grasshopper!!
Andre….JO ugly, that for sure! Not only has Coffee been weak, commodity based ETF’s can make a bad story worse. The chart on Coffee is of the futures contract. Several rallies have been strong coming off this support. Could a Coffee futures rally of a decent percent help JO? Yes it could. Would not want to own either though on a break of the 7-year support line.
Chris
(JO) ETF look kind of ugly ! Just 4% off from lows !? what is the best way to play it ? Thanks