CLICK ON CHART TO ENLARGE
Over the past two years, when XLF hit a certain resistance line, financials and SPY took a breather. XLF is nearing channel and Fibonacci resistance at (2) in the above chart.
A breakout above resistance at (2) would make Banks and the S&P 500 feel even better than they do now!
CLICK ON CHART TO ENLARGE
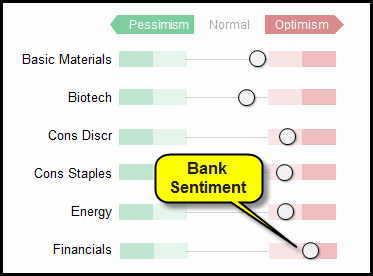
The above chart reflects many investors are feeling good about Financials right now as optimism is very high, as it is nearing the top of its channel. S&P 500 owners would feel a ton better if XLF could break resistance at (2) in the top chart!
–


Screw the banks. Screw the banker scum. In a just world, they’d all be crushed to dust, not bailed, given interest free money, and afforded immunity from prosecution.