CLICK ON CHART TO ENLARGE
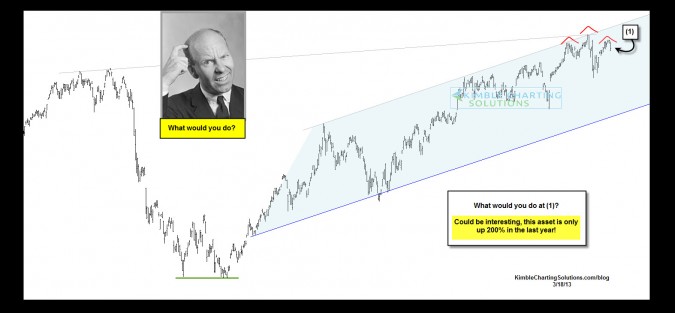
Is one of the “Hottest ETF’s” on the planet creating a “Head & Shoulders” topping pattern?
The above chart was the quiz from 3 days ago. This chart reflects a potential “Head & Shoulders” topping pattern at the top of a rising channel as well as another resistance line at (1). See Opportunity post here
VIX index, the opposite of the chart above is up 7% today (VIX Index)
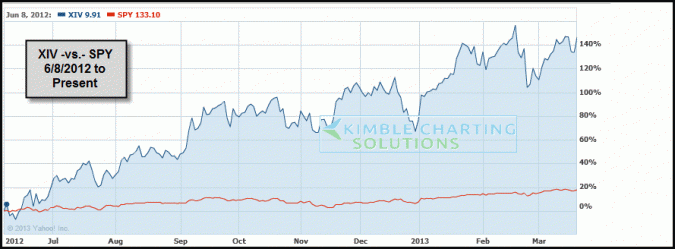
Since June of last year, this ETF is up 120% MORE than the S&P 500, reflected in the chart below.
CLICK ON CHART TO ENLARGE
Could this inverse VIX ETF be sending a signal that the markets are at a critical top? If this pattern is correct, XIV could fall a large percentage and VIX could see a strong rally. Stay tuned!
–
–


