CLICK ON CHART TO ENLARGE
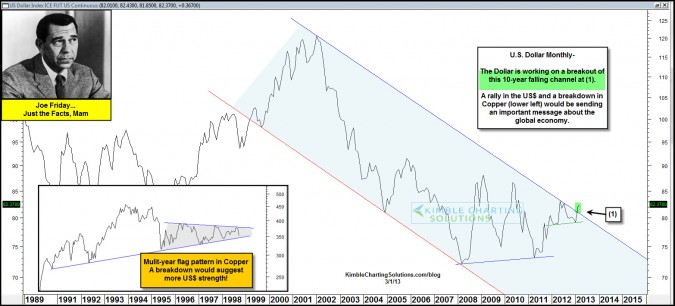
The U.S. Dollar, on a monthly closing basis, has created a series of higher lows since 2008. Now the US$ is working on doing something it hasn’t done for the past 10-YEARS in the chart above!
Joe Friday says.… A US$ breakout of a 10-year falling channel is something to respect, after it has made a series of higher lows since 2008. If Copper breaks down from its multi-year flag pattern, the combo would be sending a global message in regards to portfolio construction…be cautious with weightings towards risk assets!
–
–


High yields are acting very well, no breakdowns to be concerned with at this time. Shoe box doing ok too!
Falling resistance since 2005 still in play? Associated flag?
High yield update?
please send your offer on prediciton of pm prices
thank you
Tom Holland
More concretely, the “global message in regards to portfolio construction” would be: liquidate your portfolio including stocks, bonds, gold, silver, other commodities, real estate, and collectables; get into cash and liquid risk-free cash equivalents; prepare for deflation.
It is interesting to observe, though, that the parabolic stock bull market of the second half of the nineties was accompanied by a strong dollar rally, and during much of the 2000-2003 bear market, the dollar fell in parallel to stocks. The current, inverse correlation of stocks and the greenback seems to have started only in 2006: historically, the timespan of inverse correlation 2006-2013 is shorter than that of correlation 1995-2006. Will a huge rise in the dollar cause a huge drop in stocks? Or could correlations change again?