CLICK ON CHART TO ENLARGE
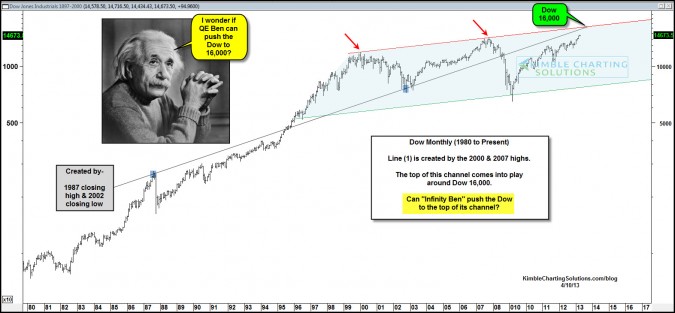
Can “Infinity Ben” push the Dow to 16,000? Why could Dow 16,000 be important from a technical perspective? The top of channel resistance for the Dow comes into play around Dow 16,000, with another line tied to the 1987 highs and 2002 lows coming into play around the same levels, with them intersecting a few months from now.
Can easy money policies from “Infinity Ben” push the Dow to 16,000? I guess anything is possible these days. If the Dow does reach this milestone, two key resistance lines will be staring it in the face and I would want to do some harvesting of values!
–


Steve…I am taking the emotional extremes society has created. For some odd reason “charts have memories” and I just attempt to bring those memories to light and how they can reflect important support/resistance/turning points.
I’m no chartist, but that line from 1987 to 2002 looks pretty arbitrary and meaningless to me.
Have you considered a megaphone pattern since 2000? That looks to make the most sense to me. That would incorporate your red upper trend line, which I think is very valid.
Do you have any theoretical justification for creating a support/resistance line connecting highs and lows? Any backtesting? Anything?