CLICK ON CHART TO ENLARGE
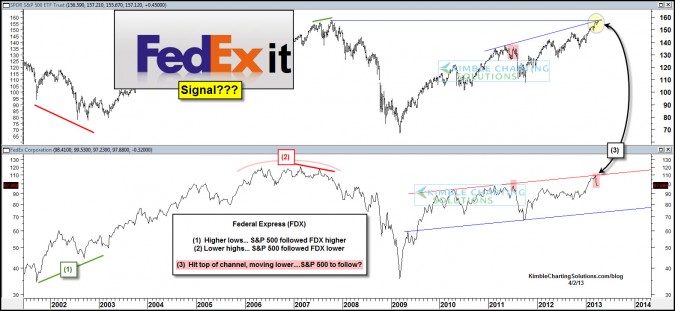
Federal Express has been a good leading indicator for the S&P 500 over the past 10 YEARS! Back in 2002, FDX created higher lows and the SPY followed. In 2006/2007 FDX created lower highs and the SPY followed it down.
Now Fed Ex could be sending an “EXIT” signal for the markets/SPY as it hit the top of its rising channel and has been breaking down of late!
Fed Ex has been a good leading indicator at bottoms and tops. Will it be different this time???
–
–


I am looking for a top in the SP when this dia. tri is done, which should be within a few days. My target was 1576.30spx but it can certainly go up to the low 1580’s if it hits buy stops above the old high. Under EW, this is a large corrective pattern off the 666 spx lows. There is a very real chance the entire up leg of nearly 912 points could be retraced from this upcoming top. Very few would believe such a correction is possible with the Fed’s involvement, but ask a “master chartist” what he/she sees.
I have been expecting a flat ( 900 pt.) “b” wave rally up to the 1560-1570 area for years. Now we are there. If my “b” wave unfolds as correct, what follows ( provided this is a flat “b”) is a C wave back down of near 900 pts.
The better the chartist, the easier it is to accept this possibility. It will begin with a sharp 35 point drop down to 1530’s.