CLICK ON CHART TO ENLARGE
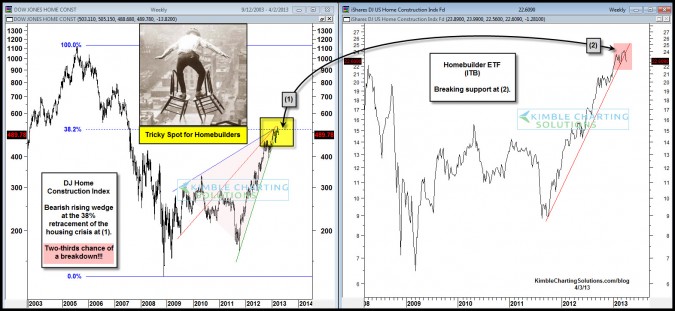
Housing took the economy and the broad markets down back in 2006-2009. The DJ Home Construction index has created a multi-year bearish rising wedge pattern, with the apex of the pattern at its 38% Fibonacci retracement level at (1) above.
Two-thirds of the time the results of this pattern is lower prices. The right chart is of ITB, the homebuilders ETF, which is breaking support at (2).
So Goes housing so goes the broad markets and the economy? What this sector does over the next few weeks is beyond important for the broad markets!!!
If the breakdown continues SRS should do rather well in the weeks ahead!
–
–


SP sell off has started. It will pop up to the 1550’s tomorrow, (1552.50 – 59.50 es)(w4), then down to 1530’s. That will complete the first wave 1 down. There was a movie years ago called “Car 54 where are you”? I think we should refer to spx as “666 where are you”?