Happy May Day!
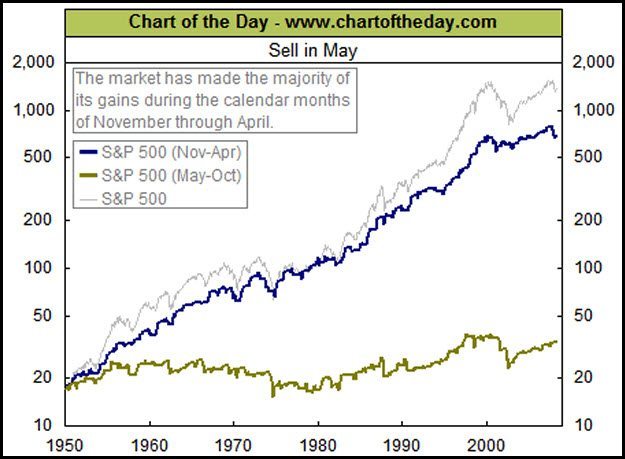
This time of year causes Wall Street to bring up the “Sell in May and go away” investment strategy. This strategy suggests that the majority of the gains in the S&P500 take place between October and May of each year.
CLICK ON CHART TO ENLARGE
The above chart, produced by chartoftheday.com back in 2008, compares the May-Oct window, Nov-Apr window and the S&P 500 since 1950. The lower line reflects the performance from May to Oct, which isn’t real impressive to say the least!
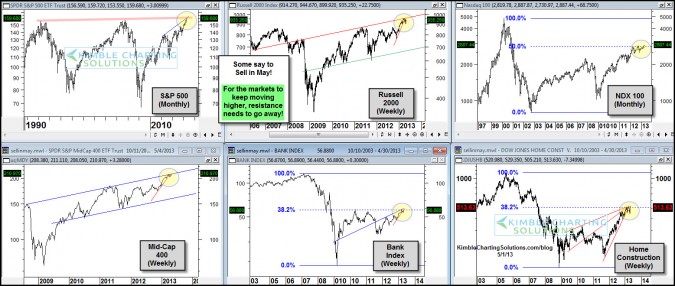
Some years the market does move higher in the May to October window. The 6-pack below reflects an important technical situation is at hand for several key markets!
CLICK ON CHART TO ENLARGE
For the markets to have a productive May to October window, which is totally possible, you can see that each of the index’s above have to take out either long-term or key Fibonacci retracement levels!!!
We will revisit the above 6-pack, 6 months from now to see if the “Sell in May and go away” was a good idea in 2013.
–


