CLICK ON CHART TO ENLARGE
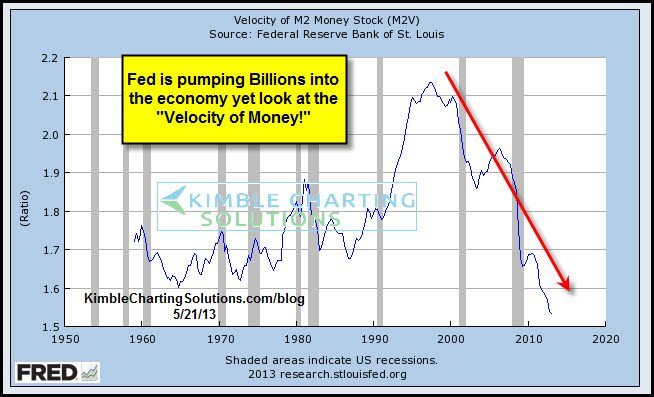
The Fed is pumping billions into the economy every month, hoping to inflate it! From a stock market perspective, many key index’s are at all-time high levels. Is the Fed succeeding to inflate stocks? Many would say yes.
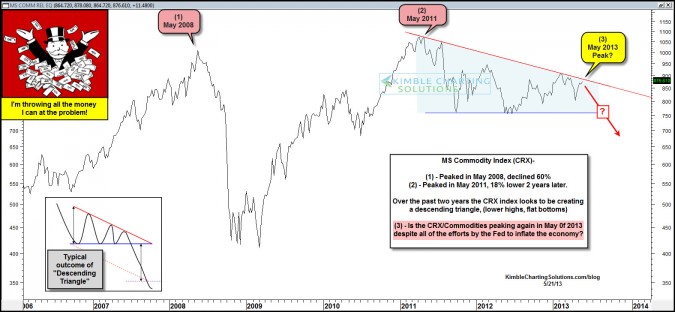
From a broad based Commodity perspective (CRX Index), higher prices are not taking place!
In fact the opposite is taking place, as the CRX index above has been created a series of lower highs since May of 2011, as the CRX index is down 18% from two years ago this month. These lower highs could well be forming a “Descending Triangle” which the majority of the time suggests lower prices are ahead.
CLICK ON CHART TO ENLARGE
Velocity is a ratio of nominal GDP to a measure of the money supply. It can be thought of as the rate of turnover in the money supply–that is, the number of times one dollar is used to purchase final goods and services included in GDP
Velocity peaked back in 2000 and is now is at its lowest levels in 50-YEARS! The CRX peaked back in 2008 and may be forming a “Descending Triangle” over the past 5-years. This pattern the majority of the time suggests lower prices are ahead.
If this resistance lines holds at (3) in the top chart and the CRX starts falling in price, it would be suggesting deflation is about to pick up speed, despite the massive money printing by the Fed!
The best news for the global economy would be…..CRX breaking resistance, reflecting global commodity strength. Watch the CRX in the next couple of months, it will tell us a ton about the status of the worlds economy and the Fed’s attempt to inflate!
–
–


