CLICK ON CHART TO ENLARGE
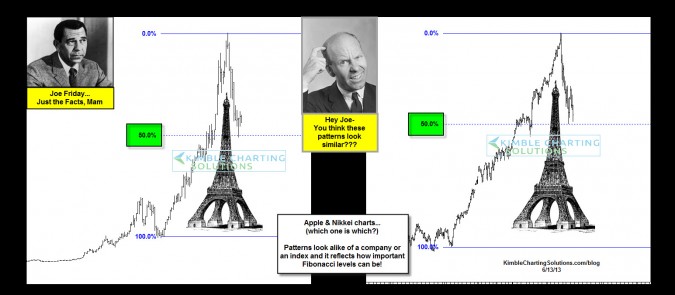
One of the charts above is Apple and the other is the Nikkei 225. Do you know which is which? When it comes to patterns, who makes them? People do! Regardless of a company or an index of a country, patterns often repeat, because they are created by people, motivated by fear and greed!
Joe Friday….The above 2-pack reflects that the Nikkei Index and Apple look very much the same and are both testing their 50% Fibonacci support levels, at the same time.
If you care to guess which is which or would like to know the answer, send us an email to [email protected] and we will forward you the answer.
–


