CLICK ON CHART TO ENLARGE
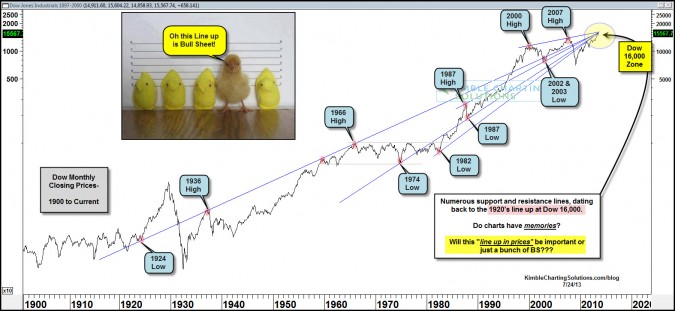
Do charts have memories? Could an confluence of support and resistance lines dating back as much as 90 years end up being important to the Dow? What would happen if the Dow breaks above this rare line up?
Some key “Emotipoints” (emotional turning points) dating as far back as the 1920’s, line up at one price zone, which comes into play around Dow 16,000. As of last nights close, the Dow is less than 500 points/less than 3% away from this confluence of Emotipoints.
CLICK ON CHART TO ENLARGE
This confluence of Emotipoints becomes all the more important when you look at the chart above (globalfinancialdata.com) , which reflects that the Dow hasn’t made any gains after subtracting for inflation in 13-years! (see post here)
Odds are high we won’t know for a while how the Dow will handle this rare situation. At this time the confluence should be viewed as resistance. If the Dow can break through this cluster of lines, it would be a very positive technical event!
–
–


