CLICK ON CHART TO ENLARGE
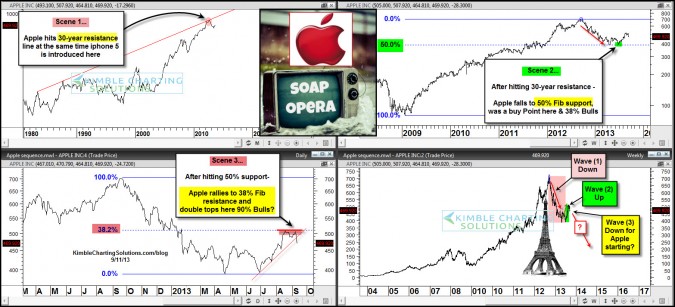
The above 4-pack are all Apple charts, reflecting its on going “Soap Opera” with key highs and lows at important resistance and Fibonacci levels. The Power of the Pattern shared that Apple was up against key resistance that lead to at least a 60%+ decline each time they were hit over the past 30-years. (see post here)
Last year Apple looked to be forming an Eiffel tower pattern (See post here)
Yesterday the Power of the Pattern shared that Apple stock had fallen hard on the introduction of the iphone5 and Apple has best hope its different this time! (see post here)
Remember, its “not the odds of an event happening that is key, its the impact if it does!” Is the jury still out, if Apple has formed an Eiffel tower pattern? Yes!
Could Apple be embarking on an “Elliott Wave 3 Down” in the lower right chart above? To early to tell, yet it could be! Again, its not the odds of the Eiffel and Wave 3 down that is key, its the impact to Apple if it is!
If the Eiffel and Wave 3 patterns are correct (which is NOT PROVEN at this time), Apple will end up much lower in price and with 80%+ of investors bullish Apple (Apple bulls at resistance) that could be a little frustrating!
–
–


