CLICK ON CHART TO ENLARGE
The above chart reflects an article from CNBC today, in regards to “Record inflows into stocks just took place this week” (read article here)
Could the S&P500 have a problem due to these inflows and what often takes place after FOMC meetings???
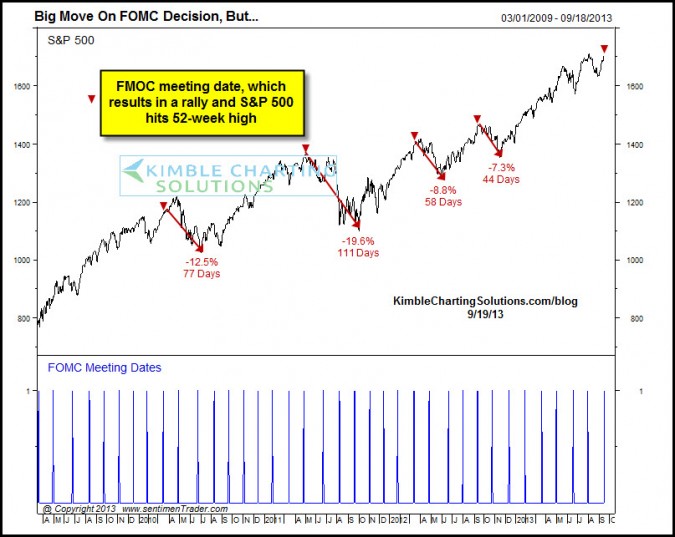
The chart below reflects how stocks have performed over the last two years, when an FOMC meeting takes place per rate cuts! Chart from Sentimentrader.com
CLICK ON CHART TO ENLARGE
Results after the last four meetings…..
Average decline was just under 12%,
average time of the decline, 77 days.
“Houston we could have a problem” or will it be different this time?
–
–


