CLICK ON CHART TO ENLARGE
The chart directly below reflects a 6 month rally from 11/20/12 to 5/20/12 of the Nikkei and S&P 500, in which the Nikkei gained over 48% more than SPY. I am of the belief that its important to watch the action of the hottest stock market in the world.
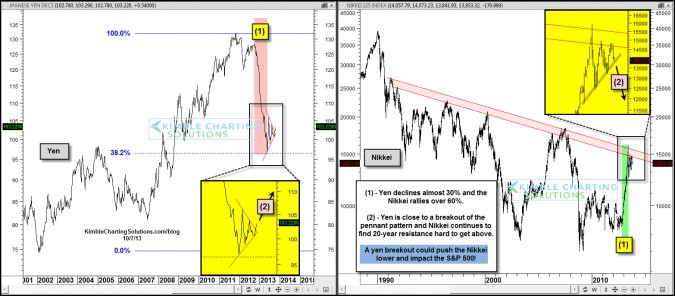
The above chart reflects that on 5/20/13, the Yen hit its 38% Fibonacci support level and the Nikkei hit a falling overhead resistance channel that has been in play for the past 20 years!
CLICK ON CHART TO ENLARGE
The chart below reflects what has happened since the Yen hit support and the Nikkei hit resistance….as the Nikkei is down 8% and the S&P has made a modest 1% gain!
This performance reflects that the Nikkei could well have an influence on the S&P 500!!!
CLICK ON CHART TO ENLARGE
The top chart reflects that that Yen could be breaking to the upside of a pennant pattern at (2) and the Nikkei is testing a key support line at (2).
Yes what happens in D.C. is important, don’t get me wrong!. Do realize this, the action in the Yen and Nikkei took place 5 MONTHS ago and it seems to continue to impact the S&P 500 today.
Investors beware of this…If the Yen should happen to take off to the upside, it would impact the Nikkei and S&P 500 in a negative way!
–
–


