CLICK ON CHART TO ENLARGE
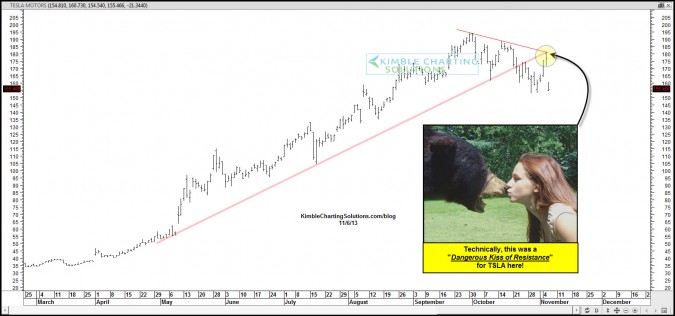
Prior to earnings last night Tesla $TSLA was kissing the underside of two key resistance lines, highlighted in the chart above. This had the potential to be a very “Dangerous Technical Kiss!!!”
A month ago I shared that TSLA could be starting to experience the impact of the right side of an “Eiffel Tower Pattern! (see post here)
–
–


