CLICK ON CHART TO ENLARGE
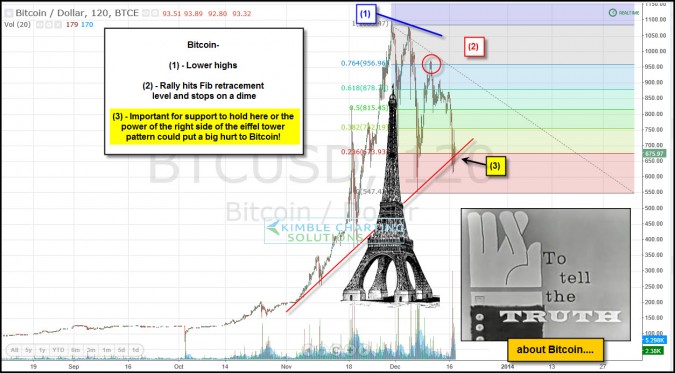
What is up 900% in less than 90 days and down 30% in less than three weeks? Bitcoin (see chart here)
Bitcoin created lower highs at (1), hit a key Fibonacci retracement level at (2) and is now on very important rising support at (3).
What happens at this support line could tell us a ton about the future value of Bitcoin. Should support break, the right side of this potential eiffel tower pattern could put a big hurt to the value of bitcoins!
–
–


