CLICK ON CHART TO ENLARGE
Looking back one year, the S&P 500 did well, up 19%. Nikkei did a little bit better, up 41%. When it comes to relative performance, the Nikkei is the clear winner, up 100% more than the S&P 500 (see performance below)
CLICK ON CHART TO ENLARGE
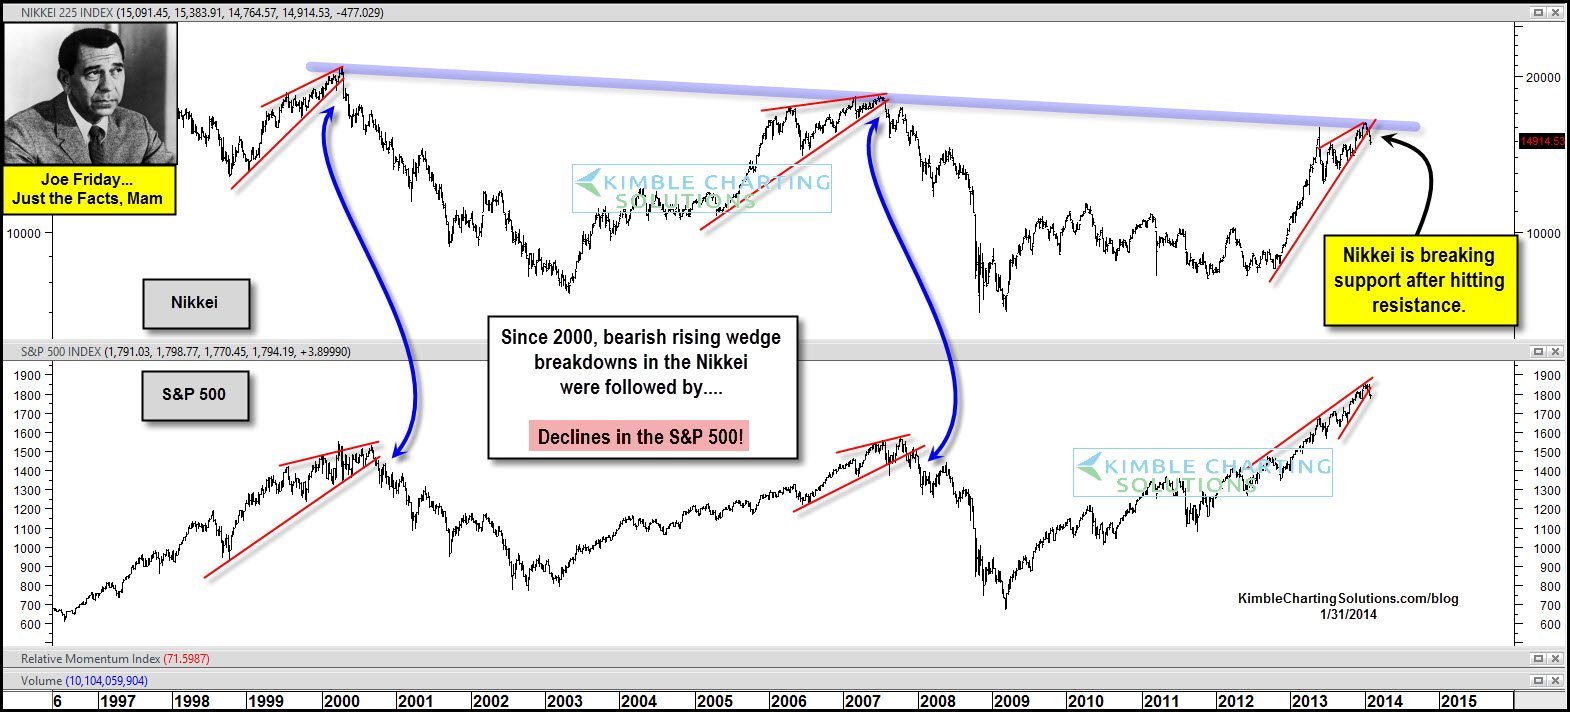
Twice since 2000, the Nikkei index has formed rising wedges, broke support and fell hard. Each time this took place, the S&P 500 soon followed the Nikkei’s lead. Some would say the Nikkei is the canary in the coal mine.
Joe Friday – The Nikkei has formed a bearish rising wedge (suggest lower prices 65% of the time) at a resistance line where other wedges have broken down and the S&P 500 followed. This situation would suggest some caution towards risk assets around the world.
–
–


