CLICK ON CHART TO ENLARGE
If an investor was loaded up with Zero Coupon Bonds from the highest quality governments in the world and shorted all .dotcom stocks, what would you guess this person was thinking would happen to the bond and stock markets going forward? Sir John Templeton did this right before the 2000 top in the stock market. Why did he do that?
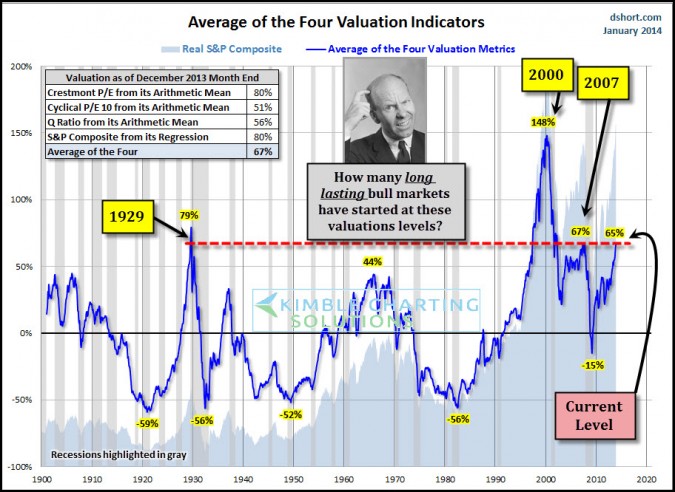
Sir John Templeton, in my humble opinion, was one of the best investors from this perspective….thinking long-term, finding bargains & portfolio construction. The above chart reflects that when he loaded up on zero coupon bonds and shorted dotcom stocks the average of four valuation indicators were hitting the highest levels in United States history, surpassing even 1929 levels.
Was Sir John a bear? I don’t think so, I feel he was just evaluating risk levels. Being bearish, in my opinion, is a psychological state of mind, not a strategy. He was doing nothing more than attempting to construct a portfolio based upon a variety of tools, one of them being valuations at the time.
Sir John would get people to think by asking something along this line…How many long lasting bull markets has started from current valuation levels? This question should be ask all the time, when valuations are high and low. The chart at the top of the post, created by Doug Short, reflects a combo of valuation indicators.
So how many long lasting bull markets have started from current valuation levels over the past 100 years? So far, none. What is the average 10-year return when valuations are at these levels? 2%! (see chart at the bottom of this post)
Does that mean the market can’t rally? No, the market could rally for a long-time from here! Does that mean one should be bearish? No!
If you are a day trader, the chart at the top of the page is totally worthless to you. If you have 401k assets, are a financial professional or individual investors looking to construct portfolios and not move monies very often and looking to beat inflation over an extended period of time, this chart might be worth being aware of.
A week ago I shared with Premium members that some proprietary indicators were sending signals that I have only seen in 2007 & 2011. If you would like a complimentary copy of this report and what these signals are, just send me an email at [email protected] and I will be happy to send this report to you.
The take from the chart at the top of the page is… Nothing more than- when it comes to portfolio construction, stocks have not had impressive long-term returns when valuations were at these levels.
Average 10-year returns with valuations at these levels is 2% (See chart below)!
CLICK ON CHART TO ENLARGE
–
–


