CLICK ON CHART TO ENLARGE
The Power of the Pattern reflected to members that a very bullish opportunity was at hand in Natural Gas as it was creating a bullish inverse head & shoulders pattern back in 2000, when few investors like it (only 17% bulls) see post here
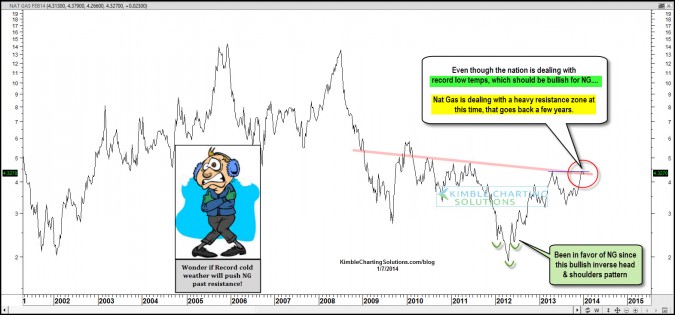
In the following 9 months, Natural Gas rallied 89%, until it hit a key falling resistance line. After hitting this resistance line in early 2013, NG fell, hit support and has been one of the best assets to own over the past 90 days…see 90 day performance below
CLICK ON CHART TO ENLARGE
Now what? Well NG is back at a resistance zone that has held it in check for the past few years. Which is more powerful…record cold temps or the resistance zone?
A much bigger H&S pattern in my opinion is at play, with this resistance zone, looking like a neckline. If you like to trade Natural Gas or if you feel like we do, that opportunities are at hand in the sector, you might want to stay on top of NG’s patterns by becoming a Sector/Commodity Sentiment extreme member!
–
–


