CLICK ON CHART TO ENLARGE
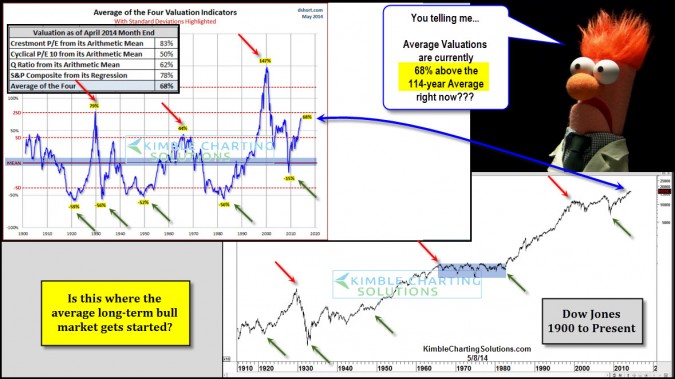
The upper left chart reflects valuations over the past 114-years, created by Doug Short. This chart combines four different ways to look at valuations and then averages them together. At this time the average of the four is 68% above the 114-year averages.
Only in 1929 and 2000, were average valuations higher than current levels.
Can the market mover higher with valuations at current levels? For sure it can!!!
Lets ask this….”How many long lasting bull markets in the past 200-years have started a current valuation levels?” So far….Zero.
With valuations at current levels can we just buy & hold or go long and close our eyes or in other words ….”Set it and forget it?” If a long lasting bull market starts from here, it would be the first in the history of the United States. In other words, from a risk management perspective should we bet on an aberration in history?
Opportunities to enlarge a portfolio regardless of market direction have NEVER been better in our lives, the tools to do so keep getting more abundant and better every year. Humbly, I believe embracing these tools and being active in portfolio construction will be very rewarding, as we wait for valuations to move closer to the 114-year averages.
–


