CLICK ON CHART TO ENLARGE
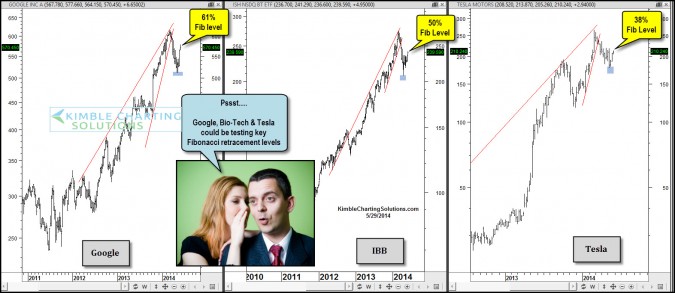
Almost 90 days ago I shared the 3-pack below, where I inverted Google, Bio-Tech and Tesla, which reflected that each had formed bullish falling wedges. Since the charts were inverted, they were suggesting that each of these three were vulnerable to a decline. In no time each of these fell on average of 20% from their highs.
CLICK ON CHART TO ENLARGE
The top chart reflects bounces have taken place since each of these hit lows on 4/15. The rallies has taken each of them back to Fibonacci retracement levels that could become very important.
Price action remains positive in the broad markets (S&P 500 and Wilshire 5000) at this time. Fibonacci doesn’t always stop rallies, but sometimes they do. These levels could become very important in determining if the rally from April 15th to now was a bear market rally or not.
Stay tuned, in my humble opinion these are important levels to watch!
-


