CLICK ON CHART TO ENLARGE
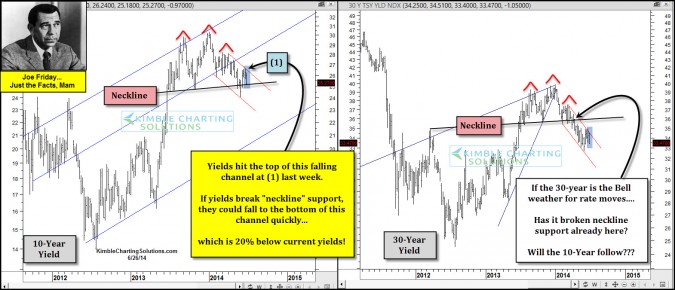
The yield on the 10-year note and 30-year bell weather bond look to be creating head & shoulders tops. The 30-year yield (right chart) looks to have broken its neckline and continues to decline inside of a falling channel since the start of 2014.
The yield on the 10-year note now looks to be testing its neckline of the bearish pattern right now, as it too remains inside of a falling channel since the start of the year.
TLT is up over 10% this year, if support breaks it could push TLT a good deal higher in short order, if the head & shoulders top is a correct read. Some might think if rates fall sharply that it could impact the stock market. Well we know it can, yet so far this year a sharp rally in bonds/decline in yields hasn’t impacted stocks so far.
Joe Friday just the facts….if support breaks and this is the neckline of a H & S topping pattern, yields could decline to the 2% zone quickly!
–
–


