CLICK ON CHART TO ENLARGE
Did Bio-Tech hit a long-term high on the week of February the 28th? The jury is still out on this question I feel. We could find out a good deal about this question in the next week!
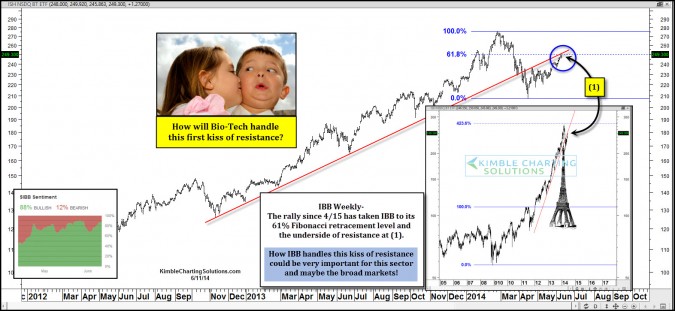
Bio-Tech peaked around the first of March and fell for six weeks (declining around 20%) then it reversed the decline, moving higher since April the 15th. The rally has recovered 61% of the decline and now has IBB kissing the underside of a key support line, now as resistance at (1) in the chart above.
The inset chart reflects how well IBB has done over the past 10-years and how sharp the rally over the past three years has been…..very impressive for sure!
In my humble opinion, how IBB handles this first kiss could tell us a ton about this hot sectors direction in the near term, which can from time to time influence the broad markets.
–
–


