CLICK ON CHART TO ENLARGE
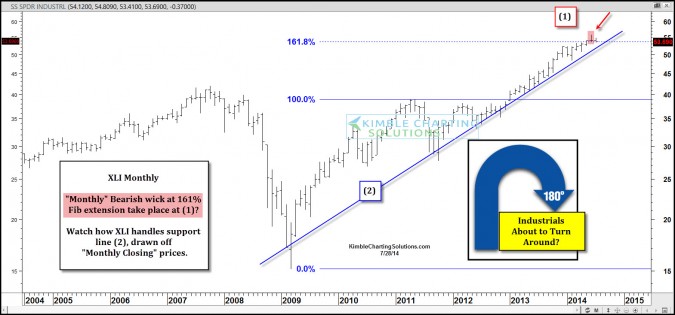
Industrial ETF XLI may have created a “Bearish Wick” on a monthly basis at its Fibonacci 161% Extension level at (1) last month. Over the past year, XLI has reflected relative strength compared to the broad market. Over the past 30 & 90 days, XLI has reflected a little bit of relative weakness.
The chart below is the Top Ten holdings of XLI that might be worth watching in the very near future!
CLICK ON CHART TO ENLARGE
Support line (2) in the top chart is drawn off “Monthly Closing” prices dating back to the 2009 low. At this time, five year support remains in place. If XLI remains weak, compared to the S&P 500, how it handles this key support line could have much to do with the direction of the broad market months from now.
Keep your eye on XLI to see how it handles support (if hit) and to see if a “Turn Around” pattern took place last month .
Check out our web site….Kimble Charting Solutions
–
–


