
CLICK ON CHART TO ENLARGE
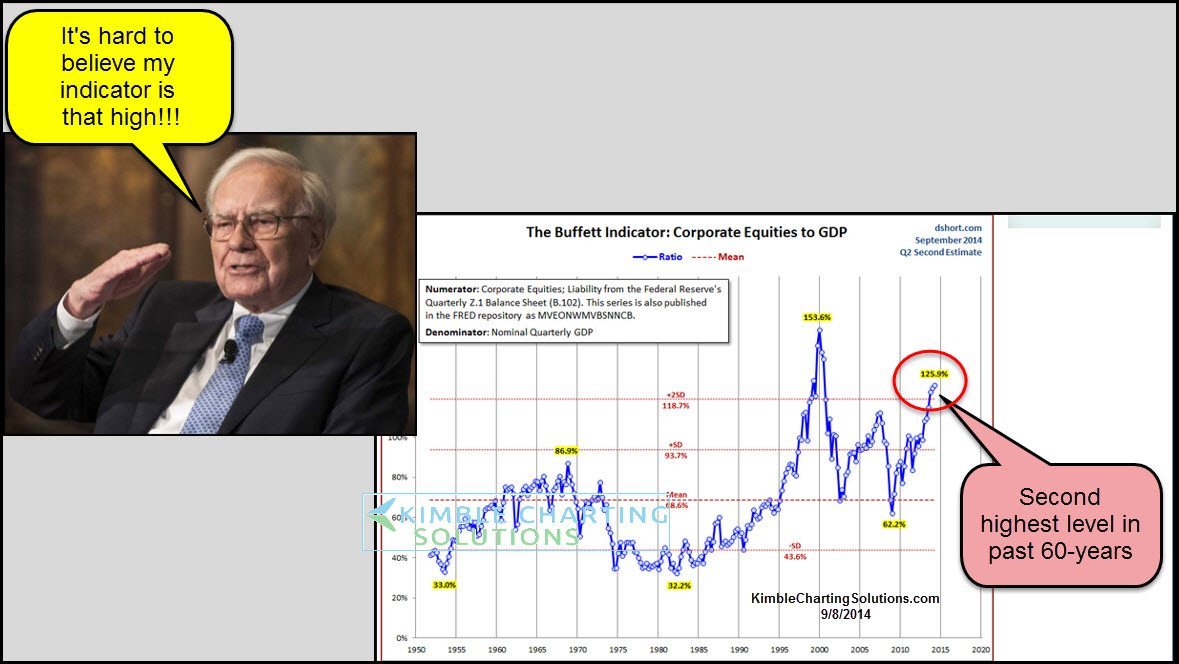
The above chart was created by Doug Short and some of his comments follow.
Market Cap to GDP is a long-term valuation indicator that has become popular in recent years, thanks to Warren Buffett. Back in 2001 he remarked in a Fortune Magazine interview that “it is probably the best single measure of where valuations stand at any given moment.”
The four valuation indicators I track in my monthly valuation overview offer a long-term perspective of well over a century. The raw data for the “Buffett indicator” only goes back as far as the middle of the 20th century. Quarterly GDP dates from 1947, and the Fed’s B.102 Balance sheet has quarterly updates beginning in Q4 1951. With an acknowledgement of this abbreviated timeframe, let’s take a look at the plain vanilla quarterly ratio with no effort to interpolate monthly data.
See complete article here
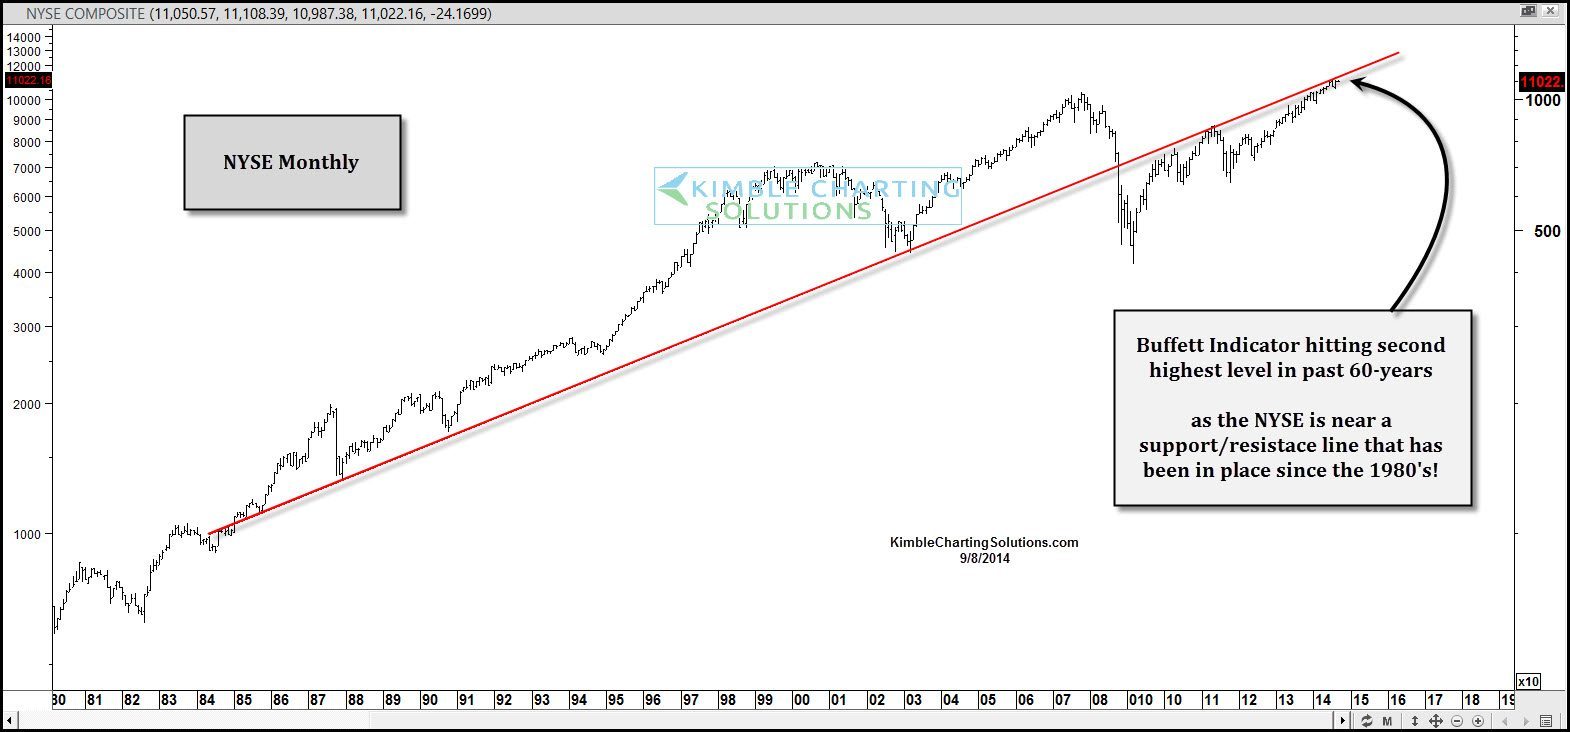
CLICK ON CHART TO ENLARGE
The long-term trend on the NYSE remains up. Watching this resistance line as valuations are at unique levels.
–
–
