
CLICK ON CHART TO ENLARGE
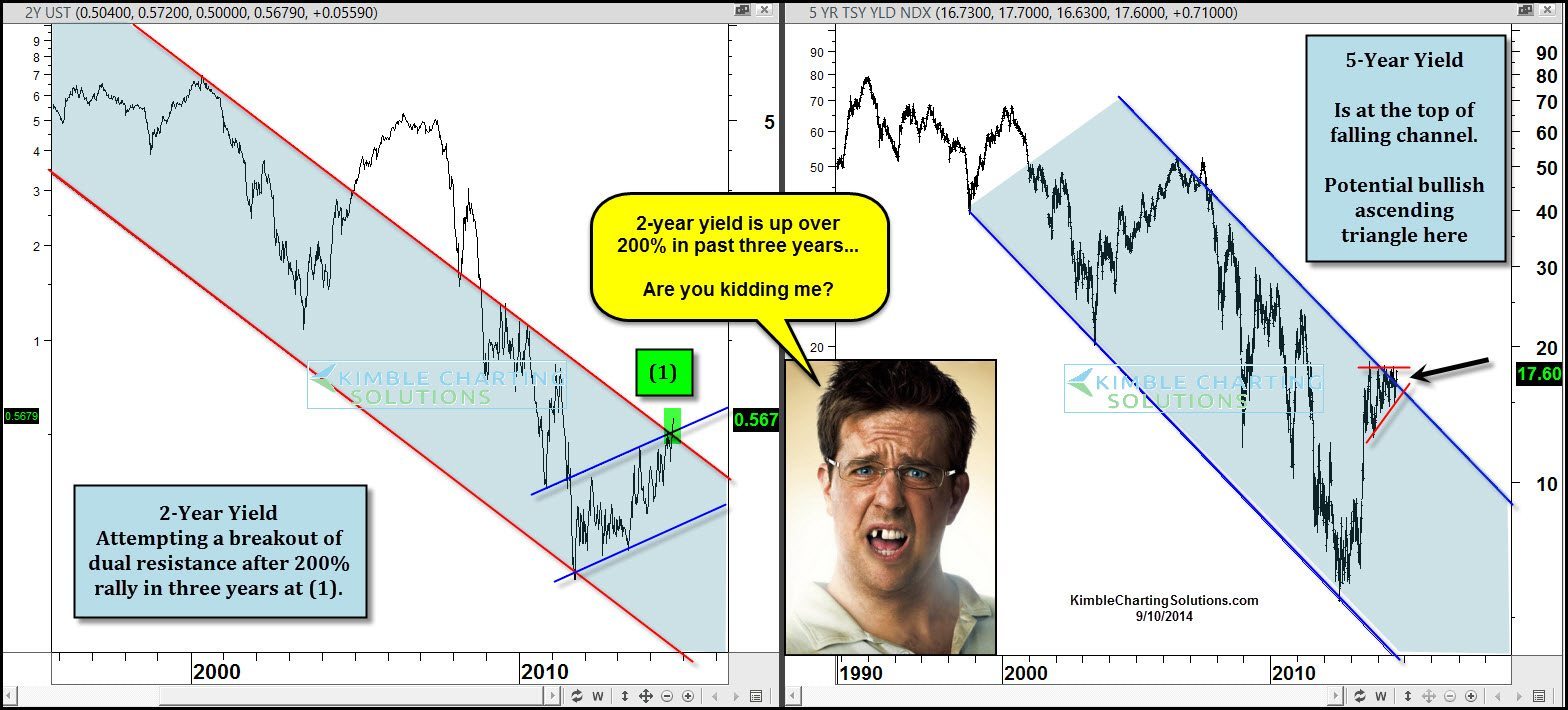
When one looks at the yields on very short term U.S. Government debt, yields on the 2 & 5-year notes are up a big percentage over the past three years.
Since 2011, the yield on the 2-year note is up over 200% (.17% to .56%) and the yield on the 5-year note is up over 100%. No doubt the actual rate remains very low on a historical basis.
The point of the two charts above is NOT the percentage increase in short-term yields we have seen over the past three years. The focus is to see if interest rate trends on a short term basis are changing and could they impact longer term rates?
The 2-year yield looks to be making an attempt to breakout of a falling channel at (1) and the yield on the 5-year note is at falling resistance and could be creating a bullish ascending triangle pattern.
New trends start from somewhere….I am watching to see if a trend change in short term rates will spill over into the longer end of the yield curve.
–
–
