CLICK ON CHART TO ENLARGE
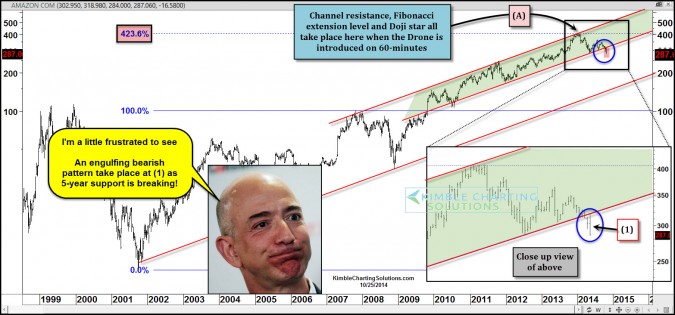
The Power of the Pattern highlighted several months ago that Amazon looked to have created a top at the same time the new drone was introduced on 60-Minutes at (A) above. As mentioned above, when the Drone was being introduced, AMZN was hitting channel resistance and a long-term Fibonacci extension level. While these two resistance points were coming into play, it also created a Doji Star topping pattern.
Lets now take a current look at what AMZN is doing. The above weekly chart reflects a break below a 5-year support line has taken place. This week it kissed the underside of this channel and failed to climb back into it, as it created a rather large bearish engulfing pattern at (1) above.
What does all of this suggest for Amazon going forward? I think Jeff’s face says it all, as price action suggests lower prices are to come. This price action could be very important for the NDX 100, due to cap weighting!
–
–


