
CLICK ON CHART TO ENLARGE
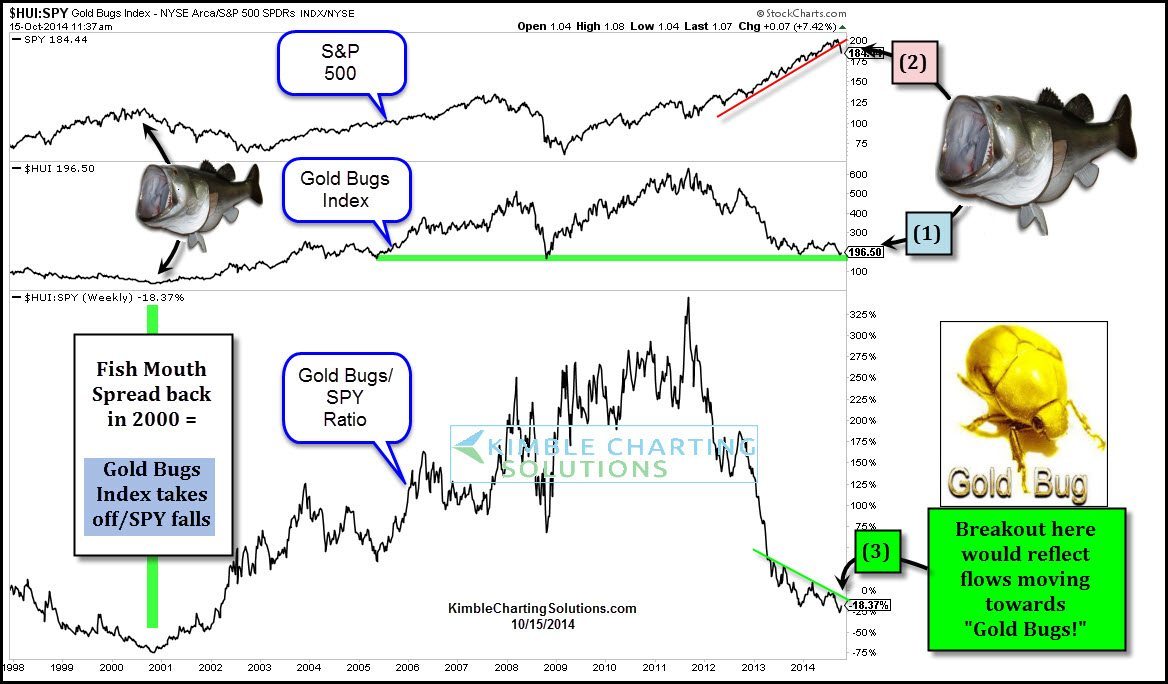
Another “Fish Mouth” pattern looks to be at hand above at (1) and (2)!
Back in 2000 this pattern took place as the S&P 500 was pushing higher in the late 1990’s and the Gold Bugs Index (HUI) was stinking it up, pushing the ratio to historically low levels.
Then the following took place in 2000- SPY broke support and the Gold Bugs index broke resistance, pushing the ratio higher for YEARS to come!
Does today look anything like in 2000? Close! The spread is very wide again, with the Gold Bugs index on potential support at (1) and the S&P looks to be breaking support at (2).
Should the ratio breakout at (3), it would suggest that flows are moving out of stocks in into miners.
If trading Gold,Silver or the miners is of interest to you, I would be totally honored to have you as a member of our weekly metals research report.
Details of the service can be found (here). Monthly sign up can be found here for just $29 per month (here), Annual Discounts (here)
–
–
