
CLICK ON CHART TO ENLARGE
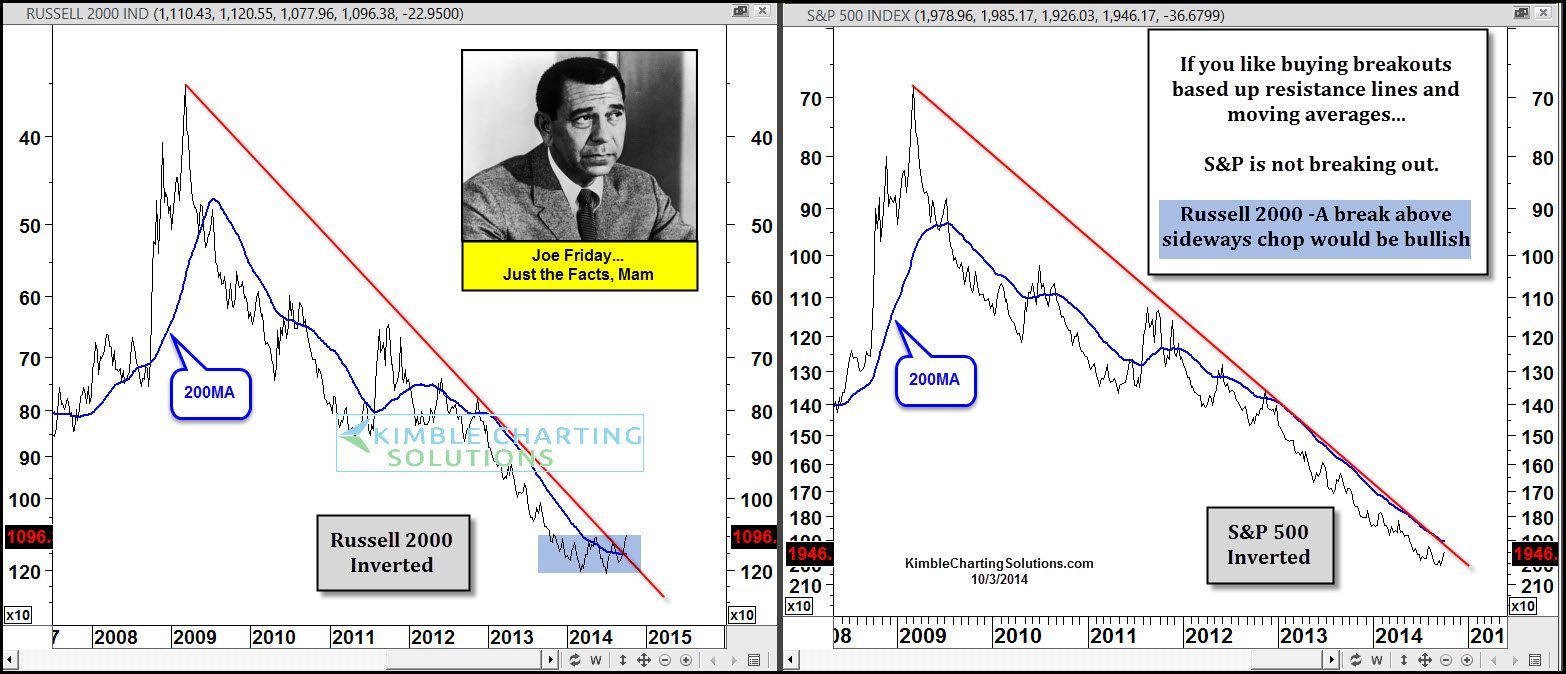
From time to time I like to look at the markets from a different perspective, as I am looking for breakouts. Sometimes standing on your head can help improve your investment results! (Market Master Article) In the above 2-pack I inverted the S&P 500 and the Russell 2000 and applied the 200MA to both of them.
As you can see the S&P 500 has NOT broken above falling resistance based off the inverted 2009 highs, nor is it above its 200MA line either.
The Russell 2000 looks a little different at this time, as it has broken above its resistance line drawn off the 2009 highs and is also attempting to push above its 200MA line.
Joe Friday….The Russell could be building a base over the past 9 months. Should a break above the blue box take place, it would be considered a breakout for small caps. RWM would be an ETF that could rise in price.
–
–
