
CLICK ON CHART TO ENLARGE
Bullish wicks/reversal patterns are usually good for any asset. When a wick takes place at a key support line, it is often even a better sign.
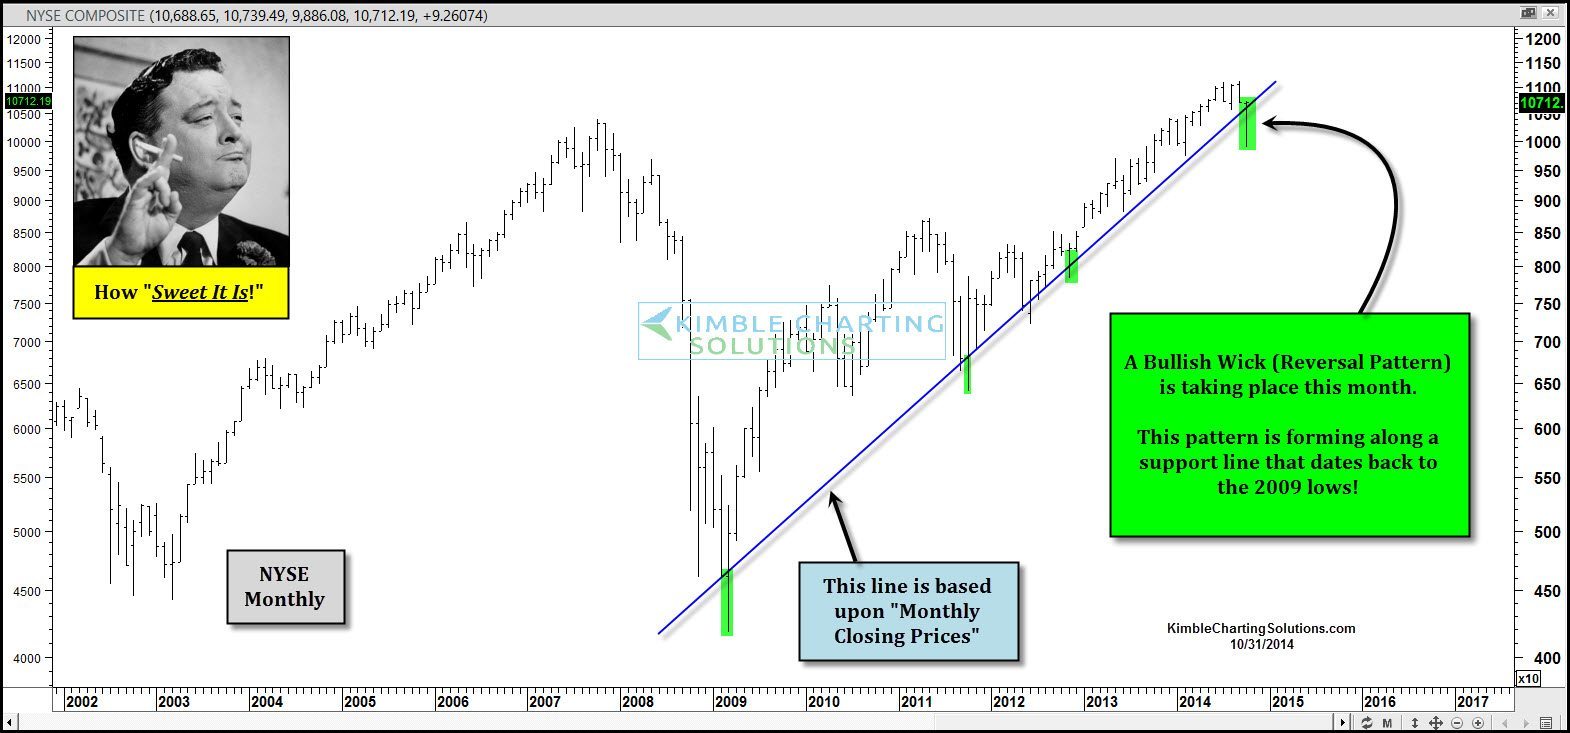
The above monthly chart of the NYSE highlights that a large bullish wick at key support drawn off the lowest monthly closing price in 2009 is taking place. This wick is almost as large as the one created at the lows back in March of 2009!
The Power of the Pattern shared on Oct the 14th (day before the low) that a rally in Russell 2000 was due and this could be a real positive for small caps and the broad markets. (See post here)
Since the posting, the S&P 500 has made more in a couple of weeks than it has made all year and the Russell has done even better than the broad markets!
This chart discusses “monthly bullish wicks” check out these huge “daily reversal wicks” that took place on Oct the 15th (in stocks & bonds), this is where the whole rally got started! (see post here)
How did Premium Members take advantage of these reversal patterns? On the morning of October the 15th, XIV was purchased as it was hitting rising support and was on its 50% Fibonacci support line and few liked this trade (76% were against the idea)!
In the 11 days following the purchase, XIV is up over 30%, making nearly as much as the S&P did all of last year.
3 Reasons why stocks could mint a shiny 4th quarter (see here)
Check out our new website here
–
–

Great trade on your part! Congrats!!!
Using 3x leveraged ETF for SP500, SPXL, you could have made 36% too in the same period, more than XIV. SPXL is very liquid. trading some 2 million shares a day with only 1 cent spread. SPXL is safer even for buy-and-hold purpose.