
CLICK ON CHART TO ENLARGE
I really like the idea of buying breakouts of resistance lines. The longer the line has been in place the bigger the potential, when resistance is finally taken out.
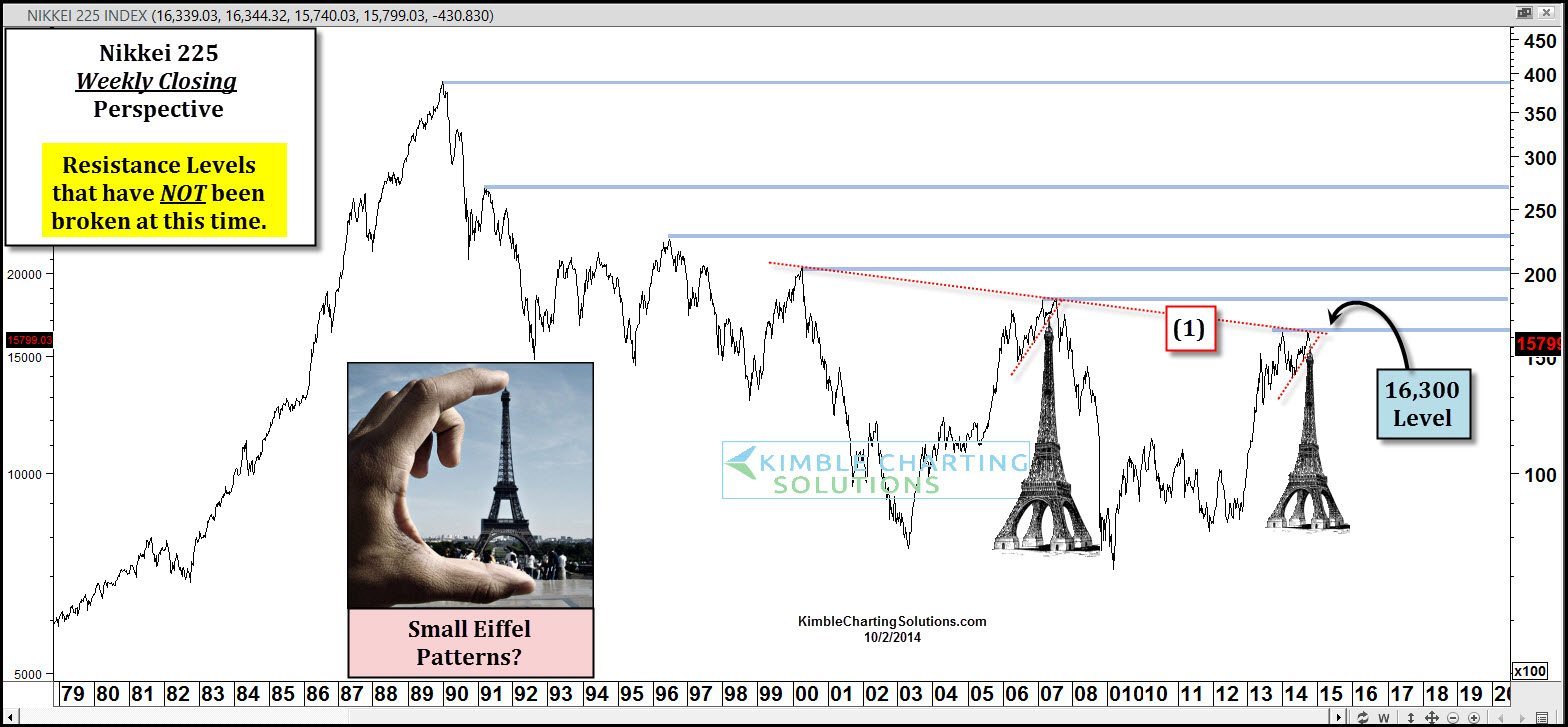
I often receive emails asking if the Nikkei has broken out. The chart above shares resistance levels based upon key “emotipoints” (emotional highs) in the Nikkei since its highs back in 1990 near 39,000.
We have all heard that “Beauty is in the eye of the beholder.” When it comes to breakouts, perspective is a big key- which resistance line do YOU choose when determining if resistance has been taken out?
From a horizontal weekly closing perspective, the 16,300 level looks pretty important to me. From a falling resistance perspective, a breakout of line (1) would be a good place to become a buyer.
Due to the potential of an Eiffel tower pattern at hand, I really need to see some proof that a breakout is at hand in the Nikkei and some key world markets before becoming a buyer here. As I shared earlier, I am interested in owning a breakout in the Nikkei, should it take place.
–
–
