
CLICK ON CHART TO ENLARGE
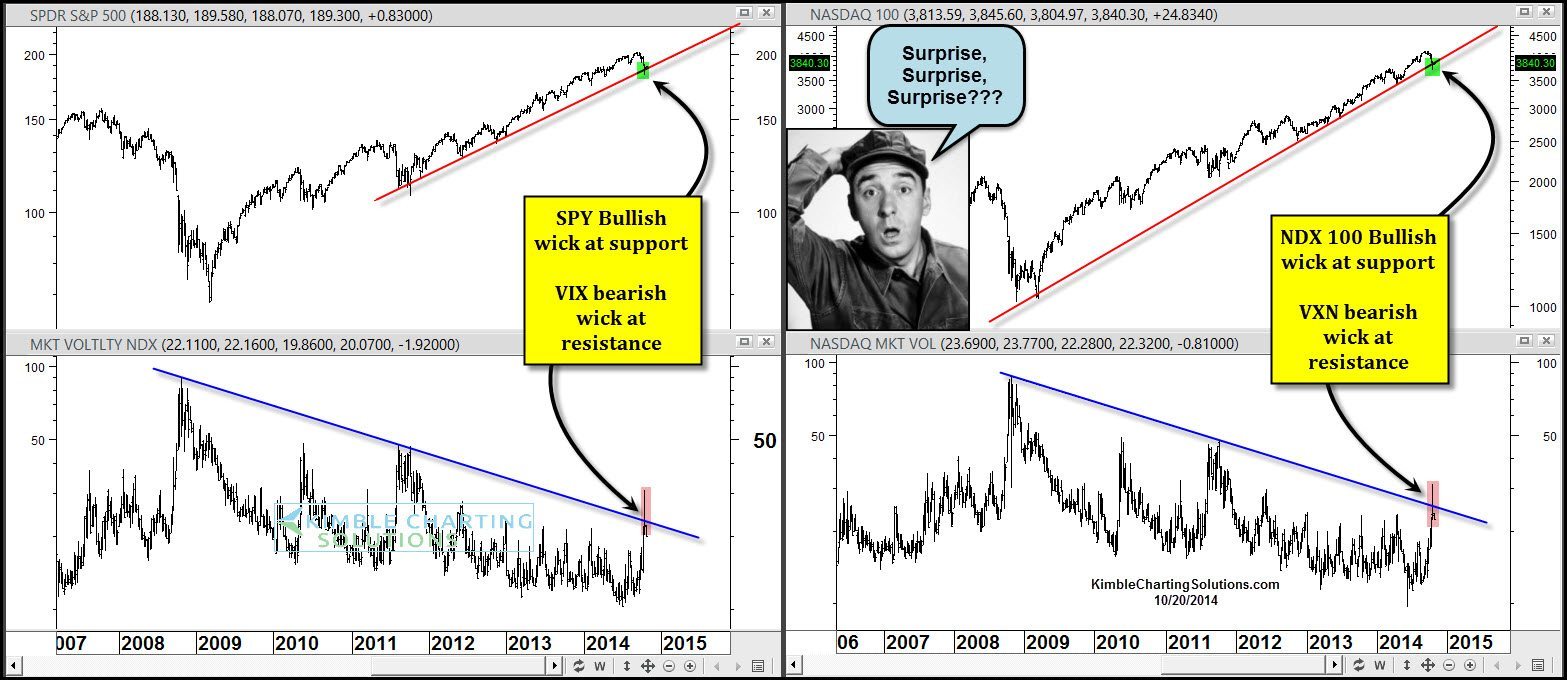
Does it surprise you how much these patterns and price action looks very much the same in the S&P 500 and NDX over the past few years?
Time will tell how key last week was, as both stock index’s were at support, creating bullish wicks and both fear index’s did the opposite, creating bearish wicks at falling resistance.
Premium Members shorted fear last Wednesday due to the patterns, with stops on this new position at fear resistance levels.
–
–
