

CLICK ON CHART TO ENLARGE
34 days ago the S&P 500 was up 2% on the year and the German Index (DAX) was down almost 6%. At that time Joe Friday shared that the DAX appeared to be sending a bullish message to global stock markets, as it looked to be creating a bullish wick at dual support at (1) above and that it could help push the S&P 500 higher (see post here).
At the same time the inset chart which was shared on 10/15 (see post here) reflected at (2) that the S&P 500 looked to be creating a bullish wick as well.
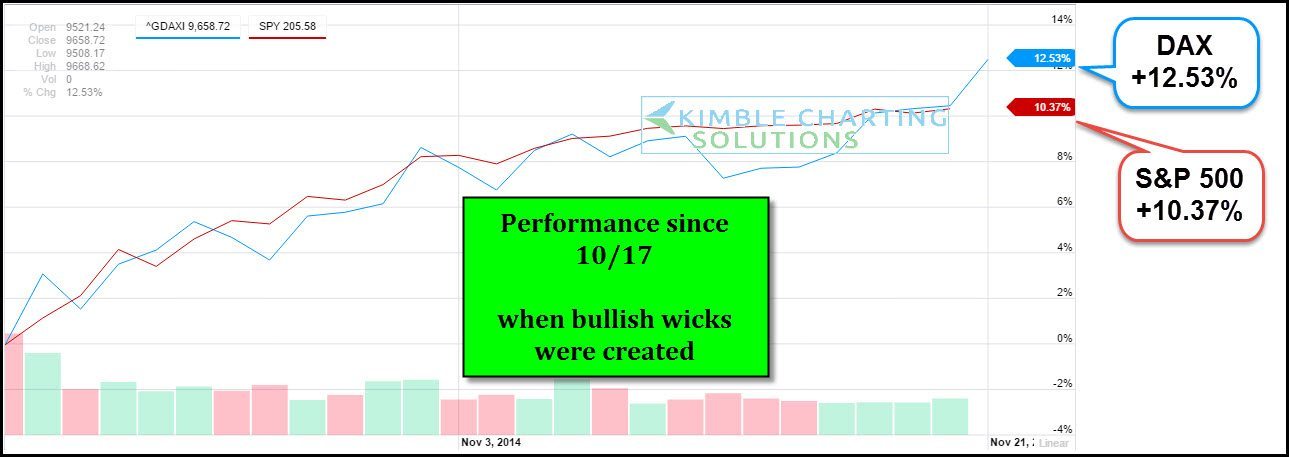
The chart below reflects the gains in the S&P and DAX since they each created the bullish wicks.
CLICK ON CHART TO ENLARGE
The above chart highlights the performance since the wicks were created and the DAX was hitting dual support. The vast majority of the years worth of gains have taken place since the wicks started to form 34 days ago!
Today the DAX is up almost 2% and many will say it has to do with China lowering interest rates. From a technical perspective, the rally looks to be a continuing process that started 34 days ago at dual support as the bullish wicks were being created!
Joe Friday just the facts…. Underestimating the Power of a bullish wick at support can lead to portfolio under performance.
Any other new bullish wicks being created at support that can be taken advantage of? Yes! I will be doing a separate post on this subject later today…Hint on the asset class….Lone Ranger
–
See our website…..HERE
